


Capital Asset Expenditure Powerpoint Presentation Slides




Try Before you Buy Download Free Sample Product
 Impress Your
 Audience
 100%
100% Editable
 Save Hours
 of Time


Capital asset expenditures are necessary inputs for cash flow projections, use our Capital Asset Expenditure PowerPoint Presentation Slides to showcase capital expenditure plan. Capital budgeting PowerPoint complete deck comprises set of professionally designed slides such as capex summary, capital expenditure details, and valuation methods, discounted payback period, valuation summary, net present value method, NPV advantages and disadvantages, internal rate of return, valuation methods comparison, etc. Capital expenses management PPT slide includes all statements and reports that are necessary for capital Improvement planning and budgeting. Additionally, capital asset management can be used to present cash flow analysis, capital asset management, operating expenses, balance sheet, income statement, corporate finance, capital cost management, accounting reports, financial planning and forecasting, capital and revenue expenditure and many more. Download asset expenditure presentation graphics to analyze financial performance. Our Capital Asset Expenditure Powerpoint Presentation Slides can be your hallmark. Customers have faith in their guarantee.
People who downloaded this PowerPoint presentation also viewed the following :
Content of this Powerpoint Presentation
Slide 1: This slide introduces Capital Asset Expenditure. State Your Company Name and begin.
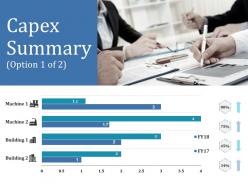
Slide 2: This slide showcases Capex Summary. You can add the data as per your requirement.
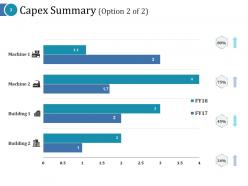
Slide 3: This slide shows Capex Summary. This slide shows bar chart with the financial year.
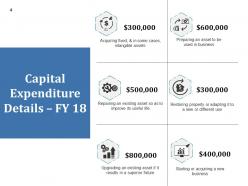
Slide 4: This slide showcases Capital Expenditure Details and also includes these data we have added. You can add your own as per your requirement.
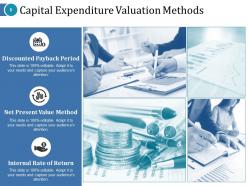
Slide 5: This slide presents Discounted Payback Period which further includes these three methods- Capital Expenditure Valuation Methods, Net Present Value Method, Internal Rate of Return.
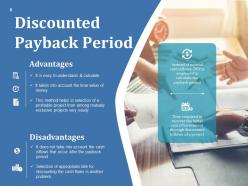
Slide 6: This slide showcase Discounted Payback Period with advantage and disadvantages.
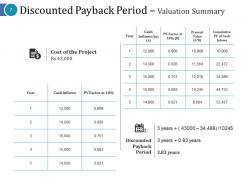
Slide 7: This slide shows Discounted Payback Period – Valuation Summary. You can add the data in the table as per your requirement.
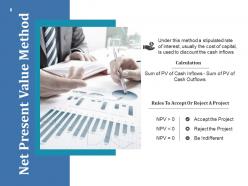
Slide 8: This slide presents Net Present Value Method. You can use the formula for calculations.
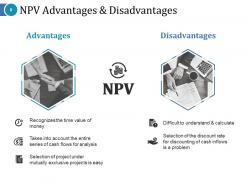
Slide 9: This slide shows NPV Advantages & Disadvantages. You can your own or edit it as per your requirement.
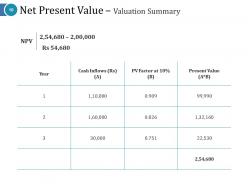
Slide 10: This slide showcases Net Present Value – Valuation Summary table. You can add the information and use it accordingly.
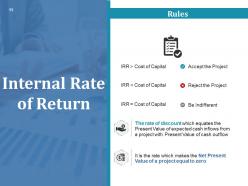
Slide 11: This slide presents Internal Rate of Return. You can add the data as per your need.
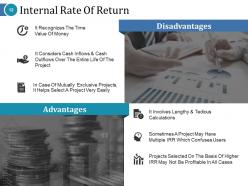
Slide 12: This slide displays Internal Rate Of Return with these - Advantages, Disadvantages.
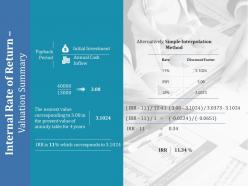
Slide 13: This slide presents Internal Rate of Return – Valuation Summary. Use it as per your requirement.
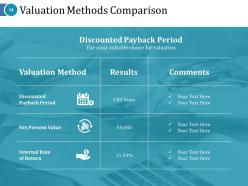
Slide 14: This slide showcases Valuation Methods Comparison with these you can compare the results of- Discounted Payback Period, The most suitable choice for valuation.
Slide 15: This slide shows Capital Asset Expenditure Icon.
Slide 16: This is a Coffee Break slide to halt. You may change it as per requirement.
Slide 17: This slide is titled Charts & Graphs to move forward.
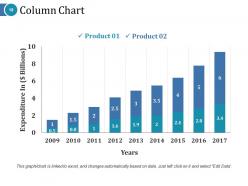
Slide 18: This is a Column Chart slide for product/entity comparison.
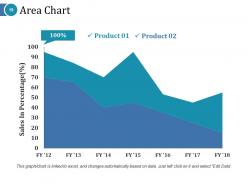
Slide 19: This is an Area Chart slide for product/entity comparison.
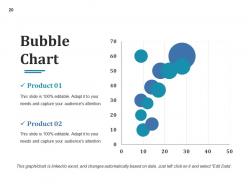
Slide 20: This slide presents a Competitive Analysis Bubble Chart for product specifications to show.
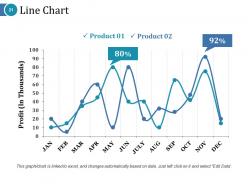
Slide 21: This is a Line Chart slide for product/entity comparison.
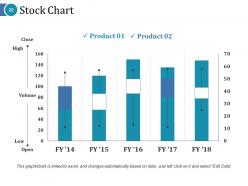
Slide 22: This slide displays a Stock Chart with volume as parameter in terms of high and low, open and close.
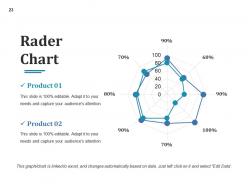
Slide 23: This slide shows Competitive Analysis with Scatter Chart/Radar Chart to compare.
Slide 24: This slide is titled Additional slides to proceed forward.
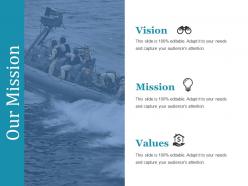
Slide 25: This is Our mission slide with imagery and text boxes to go with.
Slide 26: This is an About us slide to state company specifications etc.
Slide 27: This slide presents a Project Management Team with names and designation.
Slide 28: This is an Our Goal slide. State your important goals here.
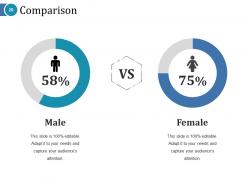
Slide 29: This slide showcases comparison slide. You can use it to compare the men and women.
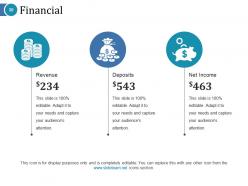
Slide 30: This slide presents Financial scores to display.
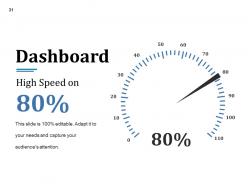
Slide 31: This is a Dashboard slide displaying- Revenue, Purchase Value, Units Sold.
Slide 32: This is a Business Quotes slide to quote something you believe in.
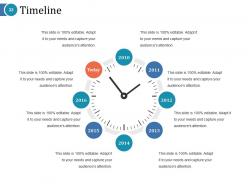
Slide 33: This is a Timelines slide to show- Plan, Budget, Schedule, Review.
Slide 34: This slide showcases a Puzzle with imagery.
Slide 35: This is a Target slide. State your targets here.
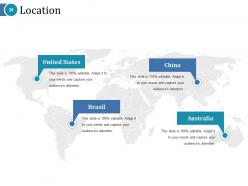
Slide 36: This is a Location slide of World map to show global presence, growth etc.
Slide 37: This slide shows a Mind map for representing entities
Slide 38: This is a Post it slide to mark reminders, events etc.
Slide 39: This is a Venn diagram image slide to show information, specifications etc.
Slide 40: This slide displays a Bulb or idea image.
Slide 41: This is a Thank You image slide with Address, Email and Contact number.
Capital Asset Expenditure Powerpoint Presentation Slides with all 41 slides:
Ensure the flow of information with our Capital Asset Expenditure Powerpoint Presentation Slides. Establish the desired degree of awareness.












FAQs for Capital Asset Expenditure
CapEx involves purchasing long-term assets like equipment, buildings, and technology that provide value over multiple years, while OpEx covers day-to-day operational costs such as salaries, utilities, rent, and maintenance expenses. These distinctions significantly impact financial planning, tax treatment, and cash flow management, with many organizations finding that balancing both expenditure types strategically enhances operational efficiency and competitive positioning.
Businesses can effectively budget for capital expenditures by conducting comprehensive asset assessments, aligning investments with strategic goals, prioritizing projects by ROI potential, and establishing multi-year forecasting frameworks. Through detailed market analysis and cross-departmental collaboration, organizations streamline resource allocation, minimize unexpected costs, and enhance operational efficiency, with many companies finding that systematic CapEx planning delivers sustainable growth and competitive advantage.
Capital expenditures include manufacturing equipment, IT infrastructure, buildings and facilities, vehicles and transportation assets, and research and development investments. These strategic investments enable organizations to enhance operational efficiency, expand production capacity, and maintain competitive advantage, with companies in manufacturing, healthcare, and technology sectors finding that well-planned capital investments drive long-term growth and profitability.
Financing options significantly influence capital expenditure decisions by affecting project costs, cash flow timing, and overall financial strategy. While debt financing enables larger investments with tax advantages, equity financing provides flexibility without repayment obligations, and leasing offers lower upfront costs, with many organizations finding that strategic financing combinations ultimately enhance project viability and competitive positioning.
Depreciation systematically allocates capital expenditure costs across an asset's useful life, matching expenses with revenue generation periods and providing accurate financial reporting. This accounting method enables organizations to spread major investments over time, improve cash flow management, and maintain realistic profit margins, while ensuring compliance with accounting standards and delivering more accurate assessments of operational performance.
Businesses evaluate CapEx viability through financial metrics like net present value, internal rate of return, and payback period, alongside cash flow analysis and risk assessment. Companies across manufacturing, healthcare, and technology sectors increasingly use scenario planning and sensitivity analysis to model potential outcomes, ultimately ensuring projects deliver measurable returns and strategic competitive advantage.
Capital expenditure prioritization should consider strategic alignment with business objectives, expected return on investment, payback period, risk assessment, and available budget constraints. These factors work together to ensure optimal resource allocation, with many organizations finding that projects supporting operational efficiency, regulatory compliance, or competitive advantage deliver the strongest long-term value and sustainable growth.
Capital expenditure directly impacts cash flow by reducing operating cash flows in the short term, while simultaneously strengthening the balance sheet through increased asset values and depreciation schedules. These investments enable companies to enhance operational efficiency, expand market reach, and improve competitive positioning, with many organizations finding that strategic CapEx decisions ultimately deliver higher revenue streams, reduced operational costs, and sustained long-term growth.
Businesses can evaluate CapEx ROI using metrics like payback period, net present value (NPV), internal rate of return (IRR), return on invested capital (ROIC), and profitability index. These financial tools enable organizations to compare investment opportunities systematically, assess cash flow timing, and determine strategic value, with many companies finding that combining multiple metrics delivers more comprehensive investment decisions and competitive advantage.
Tax implications significantly influence capital expenditure decisions through depreciation benefits, tax credits, timing strategies, and cash flow optimization. Corporations often accelerate purchases to maximize deductions, leverage bonus depreciation schedules, and strategically time investments around tax code changes, with many organizations finding that proper tax planning can reduce overall investment costs by 15-30% while enhancing competitive positioning.
Capital expenditures significantly influence long-term growth by enhancing operational capacity, modernizing infrastructure, and expanding market reach through strategic investments in equipment, technology, and facilities. These investments enable companies to streamline operations, reduce costs, and deliver improved products or services, with many organizations finding that well-planned capital allocations ultimately provide sustainable competitive advantages.
Technology advancements significantly transform capital expenditure planning by enabling predictive analytics, automated asset monitoring, and data-driven decision-making throughout investment lifecycles. Through AI-powered forecasting and IoT sensors, organizations streamline budget allocation, minimize unexpected maintenance costs, and optimize asset performance, with many manufacturers and energy companies finding that smart infrastructure delivers enhanced operational efficiency and competitive advantage.
Companies should establish clear approval hierarchies, conduct regular portfolio reviews, implement standardized evaluation criteria, maintain detailed tracking systems, and align investments with strategic objectives. Through rigorous ROI analysis and cross-functional collaboration, organizations streamline decision-making processes, minimize resource waste, and enhance project outcomes, with many finding that systematic monitoring and post-implementation reviews ultimately deliver improved financial performance and competitive advantage.
Organizations assess capital expenditure risk through comprehensive financial modeling, scenario analysis, sensitivity testing, market research, and stakeholder impact assessments. These methodologies enable companies to evaluate potential returns, identify vulnerabilities, and develop mitigation strategies, with many finding that structured risk frameworks ultimately deliver more informed investment decisions and enhanced project success rates.
Macroeconomic factors influence capital expenditure through interest rates, inflation, GDP growth, regulatory changes, and currency fluctuations, which directly impact investment costs and strategic timing decisions. During economic expansion, industries like manufacturing and technology typically increase infrastructure investments, while economic uncertainty causes sectors such as retail and hospitality to delay major projects, ultimately creating cyclical investment patterns that affect competitive positioning.
-
Attractive design and informative presentation.
-
Awesome presentation, really professional and easy to edit.