


Control Chart Tools For Project Quality Management


Try Before you Buy Download Free Sample Product
 Impress Your
 Audience
Editable
of Time


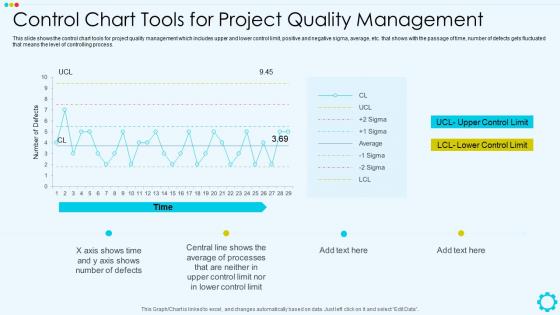
This slide shows the control chart tools for project quality management which includes upper and lower control limit, positive and negative sigma, average, etc. that shows with the passage of time, number of defects gets fluctuated that means the level of controlling process.
People who downloaded this PowerPoint presentation also viewed the following :
Control Chart Tools For Project Quality Management with all 7 slides:
Use our Control Chart Tools For Project Quality Management to effectively help you save your valuable time. They are readymade to fit into any presentation structure.


FAQs for Control Chart Tools For
A control chart is a statistical tool that monitors process performance over time by plotting data points against predetermined control limits to identify variations and trends. It enables manufacturers, healthcare facilities, and service organizations to distinguish between normal process variation and unusual patterns requiring intervention, ultimately streamlining quality assurance, reducing defects, and maintaining consistent operational standards across production cycles.
Control charts include X-bar and R charts for variable data monitoring, p-charts for defect proportions, c-charts for defect counts, and individual moving range charts for single measurements. Manufacturing teams use X-bar charts for dimensional quality, hospitals employ p-charts for infection rates, and service organizations leverage c-charts for customer complaints, ultimately delivering consistent quality standards and operational efficiency.
Control limits are determined by calculating the mean of your process data, then adding and subtracting three standard deviations to establish upper and lower boundaries. These limits are crucial because they distinguish between normal process variation and special causes requiring intervention, enabling organizations to maintain consistent quality, reduce waste, and make data-driven decisions rather than reacting to every minor fluctuation.
The central line represents the process average or mean, serving as the baseline reference point for measuring process performance and detecting variations from normal operating conditions. It enables operators to quickly identify when measurements deviate significantly from expected values, facilitating rapid corrective actions that maintain quality standards, reduce waste, and ultimately deliver consistent product outcomes across manufacturing and service operations.
Control charts help identify process variability and trends by plotting data points against established control limits, revealing patterns like shifts, cycles, or unusual variations that indicate process instability. Through statistical monitoring, manufacturing teams, healthcare facilities, and service organizations can detect early warning signs of quality issues, track performance improvements, and implement corrective actions before problems escalate, ultimately delivering consistent outcomes and reduced operational costs.
Statistical methods for control charts include moving range calculations, standard deviation analysis, process capability studies, trend analysis, and control limit calculations using three-sigma principles. These techniques enable organizations to monitor process stability, detect variations early, and maintain quality standards, with manufacturing and healthcare sectors finding that systematic statistical monitoring ultimately delivers improved operational efficiency and reduced defect rates.
Control chart interpretation involves identifying specific patterns that signal process variations, including points beyond control limits, trends of seven consecutive points moving in one direction, cycles, and shifts in process level. These patterns help organizations distinguish between common cause variations, which are normal process fluctuations, and special cause variations requiring immediate investigation, ultimately enabling proactive quality management and continuous process improvement.
Sample size significantly impacts control chart sensitivity and reliability, with larger samples detecting smaller process shifts while smaller samples may miss subtle variations but respond faster to changes. The optimal size depends on process stability requirements, cost considerations, and detection goals, with many manufacturing organizations finding that samples of 4-5 units balance statistical power with practical efficiency, ultimately delivering reliable monitoring without excessive resource allocation.
Control charts effectively extend beyond manufacturing to service industries, healthcare, finance, and IT operations through monitoring key performance metrics, response times, and quality indicators. Banks use them for loan processing times, hospitals track patient wait times and infection rates, while call centers monitor customer satisfaction scores, ultimately delivering improved service consistency and operational efficiency across diverse business environments.
Common pitfalls include using inappropriate control limits, failing to update charts with process changes, misinterpreting natural variation as special causes, and inadequate data collection methods. These issues can be avoided by ensuring proper statistical training, regularly validating chart parameters, establishing clear variation interpretation guidelines, and implementing systematic data collection protocols, with many manufacturing and service organizations finding that structured training programs significantly enhance chart effectiveness and decision-making accuracy.
Control charts integrate into continuous improvement strategies by providing real-time process monitoring, identifying variation patterns, and triggering corrective actions before defects occur. Through statistical process control, organizations streamline quality management, reduce waste, and enhance operational efficiency, with manufacturing and healthcare facilities finding that systematic chart analysis ultimately delivers faster problem resolution and sustained performance optimization.
Software tools for creating control charts include Minitab, JMP, R with quality control packages, Microsoft Excel with statistical add-ins, and SPC software like QI Macros. These platforms streamline quality monitoring by automating data collection, generating real-time visualizations, and providing statistical analysis capabilities, with many manufacturing and service organizations finding that integrated solutions significantly enhance process control efficiency and decision-making speed.
**INPUT**: How do you handle outliers in the data when using control charts? **OUTPUT**: Outliers in control charts require systematic investigation to determine their root causes, followed by either correction if they represent errors or process adjustments if they indicate genuine variations. Organizations across manufacturing, healthcare, and financial services typically establish investigation protocols, document findings, and recalculate control limits when necessary, ultimately enhancing process stability and reducing future anomalies. **Word count: 55 words**
Control charts and process capability analysis work together to provide comprehensive process monitoring and assessment, with control charts tracking process stability over time while capability analysis measures how well the process meets specifications. Control charts establish statistical control by identifying variation patterns, enabling capability studies to accurately assess process performance against customer requirements, with manufacturing and service organizations finding that this combination delivers improved quality control, reduced defects, and enhanced operational efficiency.
Regulatory standards significantly influence control chart implementation by mandating statistical process monitoring, documentation requirements, and compliance validation across industries. In pharmaceuticals, FDA regulations require control charts for batch quality monitoring, while ISO standards in manufacturing and banking regulations in financial services drive systematic quality control, ultimately ensuring consistent product safety, operational compliance, and risk management.
-
Unique design & color.
-
Much better than the original! Thanks for the quick turnaround.