


Dashboard For Tracking Active Number Of Attendances Corporate Event Communication Plan




Try Before you Buy Download Free Sample Product
 Impress Your
 Audience
 100%
100% Editable
 Save Hours
 of Time


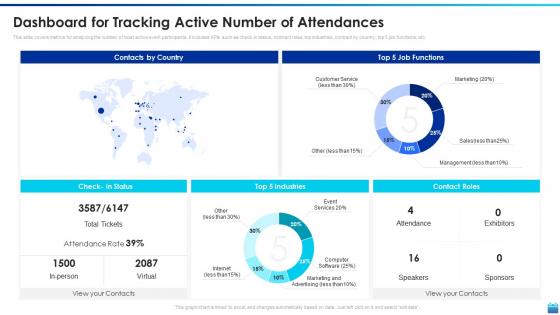
This slide covers metrics for analyzing the number of most active event participants. It includes KPIs such as check in status, contract roles, top industries, contract by country, top 5 job functions, etc.
People who downloaded this PowerPoint presentation also viewed the following :
Dashboard For Tracking Active Number Of Attendances Corporate Event Communication Plan with all 7 slides:
Use our Dashboard For Tracking Active Number Of Attendances Corporate Event Communication Plan to effectively help you save your valuable time. They are readymade to fit into any presentation structure.





FAQs for Dashboard For Tracking Active Number Of Attendances Corporate
Key metrics include real-time attendance counts, registration versus actual attendance rates, demographic breakdowns, session popularity rankings, and engagement levels across different event segments. These metrics enable event organizers to optimize resource allocation, adjust programming dynamically, and measure ROI effectively, with many organizations finding that comprehensive dashboards ultimately deliver better attendee experiences and strategic insights for future events.
Dashboards enhance event planning decisions by providing real-time attendance tracking, budget analysis, venue utilization metrics, and participant engagement data in centralized views. Through automated reporting and predictive analytics, event planners can optimize resource allocation, adjust logistics proactively, and measure ROI effectively, ultimately delivering more successful events while reducing costs and administrative overhead.
Event attendance dashboards integrate registration platforms, mobile check-in apps, badge scanning systems, social media analytics, and CRM databases to provide comprehensive visibility. These data sources streamline tracking by combining real-time attendance metrics, engagement patterns, and participant demographics, with many organizations finding that integrated dashboards deliver enhanced event ROI measurement and strategic planning capabilities.
Real-time data tracking enhances attendee engagement by monitoring session participation, networking activities, and feedback responses, enabling event organizers to make immediate adjustments to content, logistics, and interactive elements. Through live analytics dashboards, event managers can identify popular sessions, optimize networking opportunities, and address issues instantly, ultimately delivering more personalized experiences and higher satisfaction rates across corporate gatherings.
**INPUT**: What visualization tools are most effective for displaying event attendance data? **OUTPUT**: Effective visualization tools for event attendance data include real-time dashboards, heat maps, trend line charts, demographic breakdowns, and interactive filtering systems. These technologies streamline event management by enabling instant attendance tracking, identifying engagement patterns, and facilitating data-driven decisions, with many corporate event planners finding that visual analytics ultimately enhance participant experiences and optimize future event strategies.
Historical attendance data informs future corporate event planning by revealing attendance patterns, identifying high-engagement topics, and optimizing resource allocation based on past participation trends. Through analytics dashboards, event planners can predict capacity needs, select popular venues and formats, and tailor content strategies, ultimately enhancing attendee satisfaction while reducing costs and maximizing ROI.
Attendee feedback serves as crucial data input for dashboard analytics, enabling organizers to measure satisfaction scores, identify improvement areas, track engagement patterns, and assess event ROI through sentiment analysis. This feedback data integrates with attendance metrics to create comprehensive performance insights, with many corporate event teams finding that combining qualitative feedback with quantitative analytics delivers more strategic decision-making capabilities and enhanced future event planning.
Segmentation divides attendance data by demographics, engagement levels, job roles, and behavioral patterns, enabling precise audience targeting and personalized messaging. By analyzing which segments respond to specific event types, marketing teams can craft tailored campaigns, optimize resource allocation, and significantly improve conversion rates while reducing acquisition costs.
Best practices for designing user-friendly attendance dashboards include intuitive navigation, real-time data visualization, customizable filtering options, mobile responsiveness, and clear visual hierarchies with actionable insights. These design principles enhance user experience by streamlining data interpretation, enabling quick decision-making, and providing seamless access across devices, ultimately delivering improved event management efficiency and stakeholder engagement.
The dashboard adapts to different event types through customizable modules for registration tracking, session management, networking features, and feedback collection, with flexible configurations for single-day workshops versus multi-day conferences. Organizations across industries, from tech companies hosting product launches to financial institutions conducting training seminars, find that tailored dashboards streamline event coordination while delivering enhanced attendee experiences and measurable engagement outcomes.
**INPUT**: What security measures should be implemented to protect sensitive attendee information on the dashboard? **OUTPUT**: Essential security measures include multi-factor authentication, role-based access controls, data encryption, regular security audits, and secure backup protocols. These safeguards work together by restricting unauthorized access, protecting data transmission, and ensuring compliance standards, with many organizations finding that layered security approaches ultimately deliver attendee trust while minimizing breach risks. [Word count: 54 words]
The dashboard quantifies event ROI by tracking registration costs, attendance rates, lead generation metrics, post-event sales conversions, and participant engagement scores against total event expenditure. Through automated data integration, organizations can measure revenue attribution, calculate cost-per-lead, and assess long-term customer acquisition value, with many companies finding that comprehensive tracking reveals previously hidden revenue streams and justifies future event investments.
Mobile accessibility significantly enhances attendance dashboard effectiveness by enabling real-time updates, instant notifications, and on-the-go monitoring for event coordinators and attendees. This mobility streamlines check-in processes, facilitates immediate response to attendance fluctuations, and improves overall event management efficiency, with many organizations finding that mobile-optimized dashboards increase engagement rates and operational responsiveness.
Social media metrics enhance attendance dashboards by integrating engagement rates, hashtag performance, check-ins, and sentiment analysis alongside traditional attendance data. This strategic combination enables event organizers to track real-time buzz, measure content effectiveness, and identify influential attendees, while correlating social activity with physical participation, ultimately delivering deeper audience insights and improved event ROI.
Essential features include real-time attendance tracking, intuitive check-in/check-out interfaces, customizable reporting filters, mobile accessibility, and automated notification systems. These capabilities streamline event management by reducing manual processes, enhancing data accuracy, and enabling instant insights, with many corporate organizers finding that integrated dashboards ultimately deliver improved attendee experiences and operational efficiency.
-
Great product with effective design. Helped a lot in our corporate presentations. Easy to edit and stunning visuals.
-
I can say with full confidence that all your business, academic, or professional work requirements will be sufficed with SlideTeam. Their gallery is as rich as 2Million+!!