


Dashboards To Track Health And Safety Kpis Implementation Of Safety Management Workplace Injuries


Try Before you Buy Download Free Sample Product
 Impress Your
 Audience
Editable
of Time


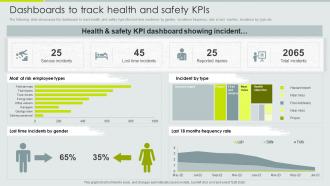
The following slide showcases the dashboard to track health and safety kpis like lost time incidence by gender, incidence frequency rate in last months, incidence by type etc.
People who downloaded this PowerPoint presentation also viewed the following :
Dashboards To Track Health And Safety Kpis Implementation Of Safety Management Workplace Injuries with all 7 slides:
Use our Dashboards To Track Health And Safety Kpis Implementation Of Safety Management Workplace Injuries to effectively help you save your valuable time. They are readymade to fit into any presentation structure.


FAQs for Dashboards To Track Health And Safety Kpis Implementation Of Safety
Focus on TRIR and DART rates first - those are your bread and butter metrics. Lost-time injury frequency matters too since that's where costs really add up. Near-miss reporting is huge though. Most companies get obsessed with what already happened instead of looking at leading indicators like training completion rates. Way more useful honestly. Don't sleep on severity rates either - one bad incident can wreck your whole year's progress. Oh, and benchmark against industry averages so you're not setting impossible targets your team will just ignore.
You'll need three things: total lost time injuries, actual hours worked (not just scheduled - that's where most places mess up), and the formula is injuries ÷ hours × 1,000,000. Monthly reporting works way better than quarterly - honestly, quarterly feels like you're always playing catch-up. Your HRIS can probably automate most of the data collection if you set it up right. The magic happens when you track trends over time and see how you stack up against industry numbers. My advice? Get your data collection process solid first. Dashboards and fancy charts can wait - they're useless if your underlying data is garbage anyway.
Oh man, near-miss reporting is like having a heads-up before things go sideways. The more close calls your team reports, the better you can spot problems before someone actually gets hurt. It's basically your workplace crystal ball - way more useful than it sounds though. High reporting rates mean people trust the system enough to speak up, which is huge for safety culture. I learned this the hard way at my last job. Make reporting dead simple and don't punish teams for high numbers. Actually celebrate them instead.
So each industry picks KPIs based on whatever their regulators care most about. Construction tracks fall incidents and PPE stuff since OSHA's obsessed with that. Healthcare watches needlestick injuries and infection rates - CDC requirements, you know? Manufacturing gets hit hard on machine incidents and chemical exposure because EPA and OSHA don't mess around there. Oil & gas companies track process safety events like crazy due to DOT pipeline rules. Honestly, the best approach is just looking at your industry's biggest regulatory headaches and turning those into measurable KPIs. Pull up your last compliance audit - that'll show you exactly what gaps need tracking.
Okay so basically - leading indicators catch problems before they blow up, while lagging ones just show you the damage after it's done. Like leading would be tracking safety training rates or how many near-misses people report. Lagging is your actual injury counts and lost time stuff. Most companies get obsessed with the lagging metrics because they're super obvious to track. But that's backwards, right? It's like trying to drive by staring at your rearview mirror the whole time. You need both types, but honestly the leading indicators are where you can actually DO something about your safety performance instead of just... documenting the mess later.
Start with OSHA's database or BLS stats to get your industry's average incident rates. Compare your TRIR and DART numbers against those benchmarks. Safety consortiums are honestly where the good data lives though - you can share info anonymously with similar companies and get way more realistic comparisons than those generic industry averages. Don't forget about leading indicators too. Things like training hours and hazard reporting rates matter just as much as the lagging stuff. I'd set up quarterly check-ins to see how you're trending. Oh, and near-miss tracking is huge but a lot of places still don't do it well.
Honestly, get your people involved in picking the metrics first - don't just decide for them. Daily dashboards work way better than monthly reports nobody reads. Team competitions are surprisingly effective (people get weirdly competitive about safety stats). Celebrate wins right when they happen, not weeks later. The whole point is making everyone feel like they own it instead of just being watched. Oh, and tie it to actual recognition programs. Short feedback loops beat long ones every time. Make it personal and visible - that's where the magic happens.
Your safety KPIs basically tell employees whether you actually give a damn about them or not. Track stuff like incident rates and near-misses, and people see you're being transparent. They feel valued. Hit a milestone like 90 days incident-free? Celebrate it - builds real team pride. But here's the thing - if you ignore these metrics, you're sending the message that profits come first. I've seen that backfire so many times. Don't just collect the data though. Talk about it in meetings and actually do something with what you learn.
Honestly, the biggest pain points are pretty predictable. People underreport stuff because they don't want to look incompetent - totally get it but it screws everything up. Different departments use completely different definitions for the same incidents, which is maddening. And yeah, data entry mistakes happen constantly. The near-miss thing drives me crazy though. Everyone thinks "nothing happened so why report it?" but those are literally your best opportunities to prevent actual disasters. You've got to make people feel safe reporting things first - no blame game. Standardize definitions across teams. Automate collection when you can. Oh, and celebrate transparency whether the news is good or terrible.
Honestly, tech makes tracking safety KPIs so much easier. IoT sensors can monitor conditions automatically, and wearable devices track employee exposure levels without you having to chase people down for data. Mobile apps let workers report incidents instantly too. The spreadsheet nightmare is basically over - which thank god because those manual calculations were killing me. AI analytics actually predict risks before stuff goes wrong, which is pretty cool. Digital dashboards show everything live, so you can spot trends fast and act on them. Way better than the old paper-based chaos we used to deal with.
Don't just track injury rates - that's measuring failure after it's already happened. Pick 3-4 KPIs max, otherwise your team gets overwhelmed and stops caring (learned this the hard way). Leading indicators work way better - stuff like training completion rates or how many near-misses people report. Actually involve your team when choosing what to measure. They know the real risks better than anyone sitting in an office. Balance is key here. You want metrics people can actually influence through what they do every day, not some abstract number from corporate.
Look, you've got to tie your safety stuff directly to money - that's what gets their attention. Track how safety impacts things like turnover, insurance costs, and production delays instead of just boring incident numbers. Pick metrics like "days without safety-related shutdowns" or connect training completion to quality scores. Leadership needs to see safety as a profit driver, not just another box to check. Honestly, once they realize good safety = less downtime and lower costs, they'll actually start caring about your reports. Just keep showing them those connections regularly.
Track how long it takes newbies to finish their safety training and quiz scores - those quiz numbers actually tell you a lot about who's gonna stick around. Time their PPE fittings and safety walkthroughs too. The first 90 days are brutal for workplace injuries, so definitely keep tabs on incident rates during that period. I'd set up monthly check-ins those first three months. Oh, and don't forget the hazard identification stuff - make sure they're documenting that properly. Catching problems early beats dealing with them later.
Set up regular review cycles - quarterly works well for most teams. Look at your trends, figure out what's causing issues, then adjust targets based on what you're actually learning. Most companies mess this up by treating KPIs like they're carved in stone. Don't do that. Track both the obvious stuff (incident rates) and the predictive metrics like training completion and near-miss reports. Your safety data will show patterns if you actually dig into it. Create action plans that loop back into better metrics. Oh, and make sure you're ready to pivot when something isn't working - stubbornness kills improvement.
Training makes a massive difference - I'm talking 20-40% drops in incident rates when companies actually do it right. Your injury numbers improve, people report more near-misses, compliance goes up. It's crazy how much better things get when workers understand the "why" behind safety rules instead of just going through the motions. I've watched places where training was basically worthless box-checking, and wow, their accident rates showed it. Focus on your biggest risk areas first and make the training specific to what your people actually face day-to-day. Generic stuff won't help anyone.
-
Wow, never been this impressed with any online service provider. Really appreciate the customer support all along from the navigation to purchasing the right products.
-
Awesomely designed templates, Easy to understand.