


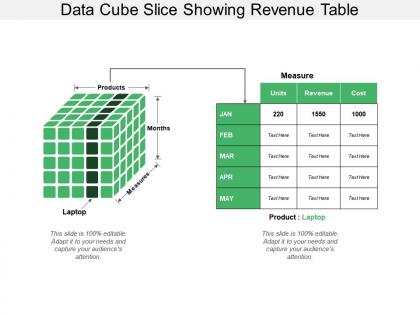
Data cube slice showing revenue table




Try Before you Buy Download Free Sample Product
 Impress Your
 Audience
 100%
100% Editable
 Save Hours
 of Time


Build facilities for a brighter future with our Data Cube Slice Showing Revenue Table.Indulge in infrastructure creation.
People who downloaded this PowerPoint presentation also viewed the following :
Data cube slice showing revenue table with all 5 slides:
Advise joggers with our Data Cube Slice Showing Revenue Table. Inform them about the correct equipment.




FAQs for Data cube slice
A data cube is a multidimensional data structure that organizes revenue information across multiple dimensions like time, geography, products, and customer segments simultaneously. It functions by enabling analysts to slice, dice, and pivot revenue data dynamically, with financial institutions and retail companies finding that cube structures accelerate reporting processes, enhance forecasting accuracy, and ultimately deliver deeper insights for strategic revenue optimization decisions.
Slicing a data cube isolates specific revenue dimensions like time periods, regions, or product lines, enabling focused analysis of performance patterns and trends. This targeted approach helps businesses identify underperforming segments, seasonal variations, and growth opportunities more clearly, with many organizations finding that dimensional slicing reveals actionable insights for strategic revenue optimization.
Key dimensions in a revenue data cube typically include time periods, geographic regions, product lines, customer segments, sales channels, and business units. These dimensions enable organizations to analyze revenue performance across multiple perspectives simultaneously, with many companies finding that this multidimensional approach streamlines financial reporting, enhances forecasting accuracy, and delivers deeper insights into revenue drivers and growth opportunities.
Businesses can utilize revenue slices by isolating specific dimensions like product lines, regions, or time periods to identify performance patterns, growth opportunities, and underperforming segments. Through targeted analysis, companies can reallocate resources, optimize pricing strategies, and enhance market positioning, with many organizations finding that dimensional revenue analysis ultimately delivers faster strategic pivots and competitive advantage.
Data visualization of revenue slices enhances comprehension by transforming complex financial data into intuitive visual formats, enabling stakeholders to quickly identify revenue patterns, compare performance across segments, and spot growth opportunities at a glance. These visual representations streamline decision-making processes by highlighting key revenue drivers, seasonal trends, and underperforming areas, with many executives finding that visual dashboards significantly reduce analysis time while improving strategic planning accuracy.
Creating and maintaining a revenue cube presents challenges including data integration complexity, performance optimization across multiple dimensions, ensuring data accuracy and consistency, managing storage requirements, and handling real-time updates. Organizations often find that balancing granular detail with system performance requires strategic resource allocation and robust data governance, while scalability considerations become increasingly critical as business operations expand.
Different slicing techniques significantly affect revenue insight granularity by enabling detailed analysis across time periods, product categories, geographic regions, customer segments, and sales channels. Through multidimensional slicing, organizations can drill down from high-level revenue summaries to specific transaction details, while cross-dimensional analysis reveals patterns like seasonal product performance or regional customer behaviors, ultimately delivering strategic insights for targeted decision-making and competitive advantage.
Revenue slices in data cube environments can indeed be automated using business intelligence platforms like Microsoft Power BI, Tableau, IBM Cognos, and Oracle ESSBASE, along with SQL-based automation scripts. These tools streamline financial reporting by enabling scheduled slice generation, real-time data refreshes, and automated distribution to stakeholders, ultimately delivering faster insights and reducing manual reporting overhead for finance teams.
Granularity determines the level of detail available when slicing revenue data, enabling organizations to analyze performance from high-level summaries down to specific transactions, products, or customer segments. Higher granularity allows finance teams to drill down into precise revenue drivers, identifying trends in specific markets, time periods, or business units, while lower granularity provides broader strategic insights for executive decision-making.
Relying solely on data cube revenue slices presents both analytical limitations and strategic risks, including oversimplified trend projections, missing external market variables, reduced sensitivity to seasonal fluctuations, and potential blind spots in customer behavior shifts. While these tools streamline historical analysis, financial institutions and retail organizations increasingly find that combining cube insights with real-time market intelligence, predictive analytics, and qualitative assessments delivers more accurate forecasting and competitive advantage.
Historical data integrates into revenue data cubes through ETL processes, data warehousing techniques, and time-series modeling that consolidate past performance metrics with current operational data. This integration enables organizations to identify seasonal trends, forecast future revenue streams, and benchmark performance across multiple periods, with many financial institutions and retail companies finding that historical context significantly enhances predictive accuracy and strategic decision-making.
Effective presentation methods for data cube revenue slices include interactive dashboards, comparative bar charts, trend line visualizations, heat maps, and drill-down tables that allow audience engagement. These approaches enhance understanding by enabling real-time filtering, highlighting performance variations across dimensions, and facilitating deeper exploration of revenue patterns, ultimately delivering clearer insights and more compelling business narratives.
Organizations ensure data accuracy and consistency in revenue cubes through automated validation rules, standardized data entry protocols, regular audit procedures, and real-time monitoring systems that flag discrepancies immediately. These comprehensive approaches enable finance teams to maintain reliable reporting across departments, streamline reconciliation processes, and deliver consistent insights to stakeholders, with many finding that automated validation reduces errors by significantly improving overall data integrity.
Industries with complex revenue streams benefit most from revenue slicing techniques, including telecommunications, retail, financial services, healthcare, and manufacturing. These sectors leverage data cube analysis to dissect revenue by product lines, customer segments, geographic regions, and time periods, with many organizations finding that granular revenue visibility enables faster strategic decisions, optimizes resource allocation, and ultimately delivers competitive advantage through precise performance insights.
Machine learning enhances data cube revenue slice insights by applying predictive algorithms, pattern recognition, and automated anomaly detection to multidimensional revenue data. Through advanced analytics, organizations can identify hidden revenue opportunities, predict customer behavior patterns, and optimize pricing strategies across different market segments, while streamlining forecasting accuracy and delivering competitive advantage in increasingly data-driven business environments.
-
Excellent template with unique design.
-
Great quality slides in rapid time.