


Data Requirement Analysis Dashboard Snapshot For Email Marketing




Try Before you Buy Download Free Sample Product
 Impress Your
 Audience
 100%
100% Editable
 Save Hours
 of Time


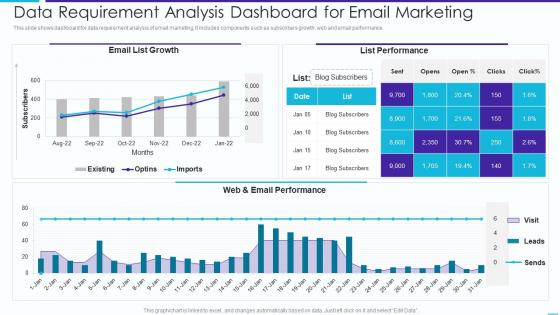
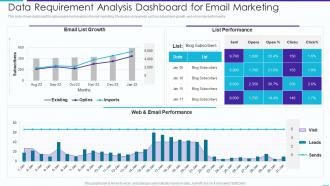
This slide shows dashboard for data requirement analysis of email marketing. It includes components such as subscribers growth, web and email performance.
People who downloaded this PowerPoint presentation also viewed the following :
Data Requirement Analysis Dashboard Snapshot For Email Marketing with all 7 slides:
Use our Data Requirement Analysis Dashboard For Email Marketing to effectively help you save your valuable time. They are readymade to fit into any presentation structure.





FAQs for Data Requirement Analysis Dashboard Snapshot
Essential email marketing dashboard metrics include open rates, click-through rates, conversion rates, bounce rates, unsubscribe rates, and revenue attribution. These metrics enable marketers to optimize campaign performance by identifying engagement patterns, deliverability issues, and ROI outcomes, with many organizations finding that comprehensive tracking ultimately delivers improved customer targeting and significantly higher campaign effectiveness.
Segmentation can be visualized through demographic heat maps, behavioral flow charts, engagement scoring matrices, campaign performance breakdowns by segment, and real-time audience filtering tools. These visual elements enable marketers to identify high-performing segments, track customer journey patterns, and adjust targeting parameters instantly, with many organizations finding that visual segmentation dashboards increase campaign effectiveness by 40% while streamlining audience management processes.
Email marketing dashboard best practices for tracking open rates and click-through rates include segmenting metrics by audience demographics, implementing A/B testing workflows, monitoring delivery timing patterns, and establishing baseline performance benchmarks. These tracking methods enhance campaign effectiveness by identifying high-performing content formats, optimizing send schedules, and personalizing subscriber experiences, with many organizations finding that strategic metric analysis ultimately delivers improved engagement rates and stronger customer relationships.
A/B testing results can be presented through comparative performance metrics, visual charts showing open rates and click-through rates, conversion funnel breakdowns, statistical significance indicators, and winner identification badges. These dashboard elements enable marketers to quickly assess test outcomes, understand audience preferences, and make data-driven decisions, with many organizations finding that clear visualization accelerates campaign optimization and enhances overall email performance.
Integrating CRM data enhances email marketing dashboards by providing comprehensive customer profiles, behavioral insights, and purchase history for highly targeted campaigns. This strategic combination enables marketers to segment audiences more precisely, personalize messaging based on customer lifecycle stages, and track revenue attribution, ultimately delivering higher engagement rates and improved ROI across campaigns.
Automation plays a crucial role in identifying email marketing trends by continuously monitoring key metrics like open rates, click-through rates, bounce rates, and conversion patterns across campaigns. These automated systems streamline data analysis, enhance pattern recognition through machine learning algorithms, and deliver real-time insights, with many marketing teams finding that automation ultimately enables faster strategic adjustments and improved campaign performance.
Campaign comparison visualization leverages side-by-side metrics displays, heat maps, trend line overlays, benchmark scoring charts, and performance ratio matrices. These dashboard elements streamline assessment by highlighting key performance indicators, conversion differentials, and engagement patterns across multiple campaigns, with many marketing teams finding that visual benchmarking accelerates optimization decisions and enhances strategic campaign planning.
Common email marketing dashboard pitfalls include overcrowding metrics without clear priorities, focusing solely on vanity metrics like open rates, ignoring segmentation insights, and lacking actionable data visualization. These issues streamline decision-making by creating confusion rather than clarity, overwhelming teams with irrelevant data, and missing conversion opportunities, with many marketers finding that simplified, goal-aligned dashboards ultimately deliver better campaign performance and strategic focus.
Email deliverability metrics can be tracked through bounce rates, spam complaints, sender reputation scores, inbox placement rates, and authentication status monitoring. These dashboard analytics enable marketers to identify delivery issues, optimize sender practices, and maintain list hygiene, with many organizations finding that proactive deliverability tracking significantly improves campaign performance and customer engagement rates.
Essential design elements include clear navigation menus, real-time performance metrics, customizable widget layouts, visual data representations through charts and graphs, and responsive mobile compatibility. These elements streamline campaign management by enabling quick access to key insights, seamless report generation, and efficient workflow optimization, with many marketing teams finding that intuitive dashboards significantly enhance productivity and decision-making speed.
ROI in email marketing dashboards is calculated by dividing net revenue generated by campaign costs, then multiplying by 100 for percentage display. These dashboards typically feature automated ROI tracking through integrated analytics, real-time revenue attribution, and comparative performance metrics across campaigns, with many marketing teams finding that visual ROI displays enhance strategic decision-making and budget allocation.
Engagement over time can be represented through trend line graphs showing open and click rates, heat maps displaying peak activity periods, cohort analysis tracking subscriber behavior patterns, and comparative charts measuring campaign performance across weeks or months. These visualizations enable marketers to identify seasonal trends, optimize send times, and measure long-term subscriber engagement, with many organizations finding that temporal data analysis significantly enhances campaign timing strategies and ultimately delivers improved conversion rates.
B2B email marketing dashboards prioritize lead quality metrics like lead scoring, sales-qualified leads, pipeline velocity, and longer conversion cycles, while B2C dashboards focus on immediate engagement through click-through rates, purchase conversions, and customer lifetime value. These different approaches reflect distinct buyer journeys, with B2B emphasizing relationship building and B2C driving direct sales transactions.
User feedback can be incorporated through integrated survey responses, unsubscribe reason tracking, reply sentiment analysis, social media mentions monitoring, and customer support ticket correlations. These feedback mechanisms enable marketers to identify content gaps, optimize send frequencies, and refine audience segmentation, with many organizations finding that direct subscriber insights significantly enhance campaign relevance and ultimately deliver higher engagement rates.
**INPUT**: What tools and software are best suited for building a custom email marketing dashboard? **OUTPUT**: Custom email marketing dashboards leverage tools like Tableau, Power BI, Google Data Studio, Looker, and Grafana for comprehensive data visualization and analytics integration. These platforms streamline campaign performance tracking by connecting multiple data sources, automating reporting workflows, and delivering real-time insights, with many marketing teams finding that strategic dashboard implementation enhances decision-making speed and ultimately drives higher engagement rates across campaigns. **Word count: 60 words**
-
Perfect template with attractive color combination.
-
The pricing page of this website is very sorted. I felt no pain while buying the PPTs.