
Declining insurance rate in rural areas case competition complete deck


Try Before you Buy Download Free Sample Product
 Impress Your
 Audience
Editable
of Time


Our Declining Insurance Rate In Rural Areas Case Competition Complete Deck are topically designed to provide an attractive backdrop to any subject. Use them to look like a presentation pro.
Deliver an informational PPT on various topics by using this Declining Insurance Rate In Rural Areas Case Competition Complete Deck. This deck focuses and implements best industry practices, thus providing a birds eye view of the topic. Encompassed with fourty two slides, designed using high quality visuals and graphics, this deck is a complete package to use and download. All the slides offered in this deck are subjective to innumerable alterations, thus making you a pro at delivering and educating. You can modify the color of the graphics, background, or anything else as per your needs and requirements. It suits every business vertical because of its adaptable layout.
People who downloaded this PowerPoint presentation also viewed the following :
Content of this Powerpoint Presentation
Slide 1: Introducing the first slide of the PowerPoint presentation titled, "Declining Insurance Rate in Rural Areas (Case Competition)." Add your company name here.
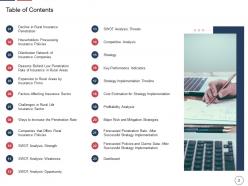
Slide 2: Share the table of contents for your presentation here, such as the decline in rural insurance penetration, factors affecting the insurance sector, ways to increase penetration rate, etc.
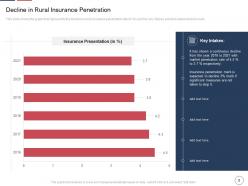
Slide 3: Introduce the first heading for your presentation in this slide i.e. the decline in rural insurance penetration.
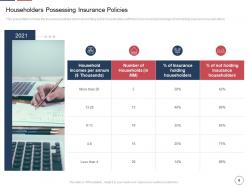
Slide 4: This presentation shows householders' insurance policies with their income and the percentage of not having insurance householders.
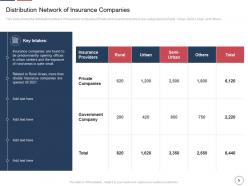
Slide 5: This slide shows the distribution network of insurance companies (Private and Government) categorized as Rural, Urban, Semi-Urban, and Others.
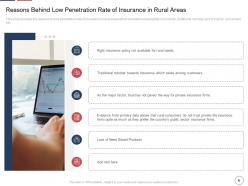
Slide 6: This slide provides the reasons for the low penetration rate of insurance in rural areas, which includes the unavailability of products, traditional mindset, lack of trust by consumers, etc.
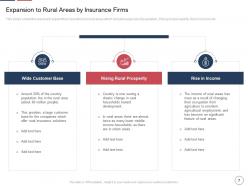
Slide 7: This slide shows the reasons to expand their operations in rural areas, including the large population size, rising rural prosperity, rise in income, etc.
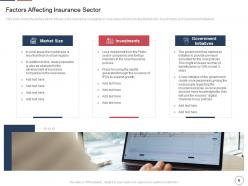
Slide 8: This slide shows the factors that influence the insurance companies in rural areas, including market size, investments, and government initiatives.
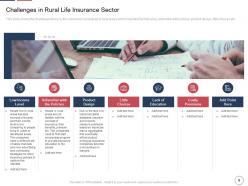
Slide 9: This slide shows the challenges faced by the insurance companies in rural areas, which include remote areas, unfamiliar with policies, product design, little choices, etc.
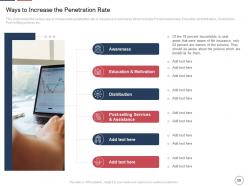
Slide 10: This slide shows the various ways to increase insurance penetration rate in rural areas, including product awareness, education and motivation, distribution, post-selling services, etc.
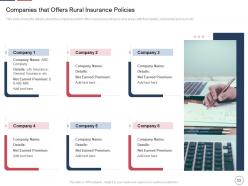
Slide 11: This slide shows the companies that offer insurance policies in rural areas with their details, net earned premium, etc.
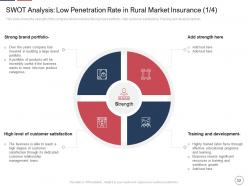
Slide 12: This slide shows the company's strength, which includes a strong brand portfolio, high customer satisfaction, training, development, etc.
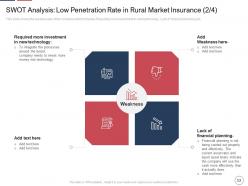
Slide 13: This slide shows the company's weaknesses, including requiring more investment in new technology, lack of financial planning, etc.
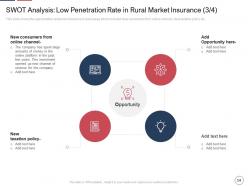
Slide 14: This slide shows the opportunities related to insurance in rural areas, which includes new consumers from online channels, new taxation policies, etc.
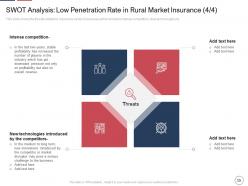
Slide 15: This slide shows the threats related to the insurance sector in rural areas, including intense competition, new technologies, etc.
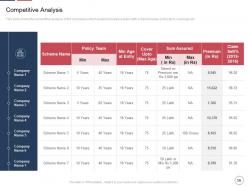
Slide 16: This slide shows the competitive analysis of the companies which deal in insurance plans with scheme names, policy terms, coverage, etc.
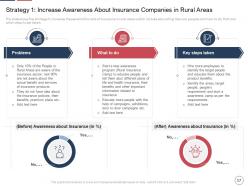
Slide 17: This slide shows the strategy to increase the insurance penetration rate in rural areas, including educating the rural people and how to do that and what steps to take.
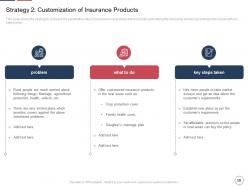
Slide 18: This slide shows the strategy to increase the insurance penetration rate in rural areas, which includes customizing the insurance policies according to the needs with key steps taken.
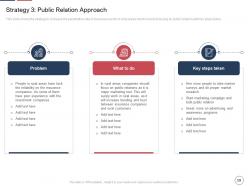
Slide 19: This slide shows the strategy to increase the penetration rate of the insurance sector in rural areas, which includes focusing on public relations with key steps taken.
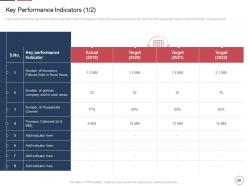
Slide 20: This slide shows the key performance indicators, including the number of insurance policies sold, the number of households, the total number of private companies, etc.
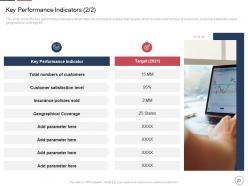
Slide 21: This slide shows the Key performance indicators which help the company achieve their targets, including the total number of customers, customer satisfaction level, geographical coverage, etc.
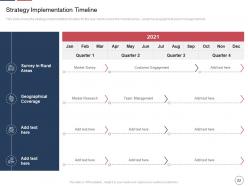
Slide 22: This slide shows the strategy implementation timeline for the year, covering the market survey, customer engagement, team management, etc.
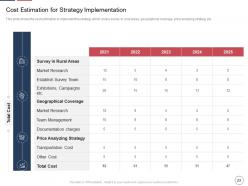
Slide 23: This slide shows the cost estimation to implement the strategy, which covers surveys in rural areas, geographical coverage, price analyzing strategy, etc.
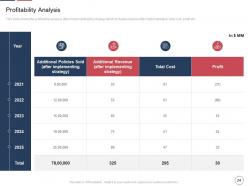
Slide 24: This slide shows the profitability analysis after implementing the strategy, which includes revenue after implementation, total cost, profit, etc.
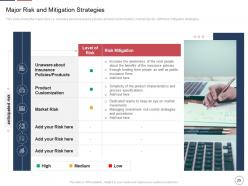
Slide 25: This slide shows the major risks, i.e. unawareness of insurance policies, product customization, market risk, etc. and their mitigation strategies.
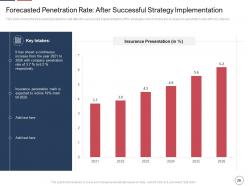
Slide 26: This slide shows the forecasted penetration rate after successfully implementing the strategies, which shows the increase in penetration rate with key intakes.
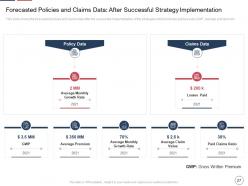
Slide 27: This slide shows the forecasted policies and claims data after successfully implementing the strategies, including policies sold, GWP, average premium, etc.
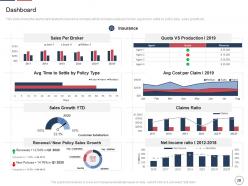
Slide 28: This slide shows the dashboard related to the insurance company, which includes sales per broker, average time to settle by policy type, sales growth, etc.
Slide 29: This is the Icons' slide for the PowerPoint presentation titled, "Declining Insurance Rate in Rural Areas (Case Competition)."
Slide 30: This slide marks the beginning of Additional slides, consisting of metrics and miscellaneous slides.
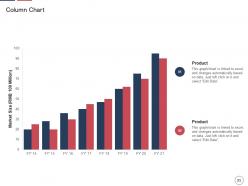
Slide 31: Here is a column chart slide to compare products and parameters on a single slide.
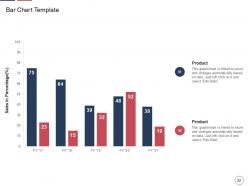
Slide 32: Use this bar chart PPT diagram to share a variation in visualization when comparing the variables of the previous slide or new ones.
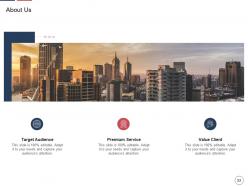
Slide 33: This is the 'About Us' slide. Highlight your characteristic features, target audience, and distinct clients in this slide.
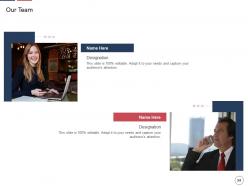
Slide 34: This is yet another creative template to focus on the key members of your team. Add their names along with their designation and profile photos here.
Slide 35: This slide provides the mission for the entire company. This includes the vision, mission, and goal.
Slide 36: Share your 30, 60, and 90 Days plans in this PPT slide.
Slide 37: This slide provides a Venn diagram that can show interconnectedness and overlap between various departments, projects, etc.
Slide 38: This is the slide to represent the financial highlights in terms of the minimum and the maximum offset of your project.
Slide 39: This is a creative aspect of this PPT presentation comprising a puzzle infographic to convey the unison between processes, departments, and workforce in general.
Slide 40: This slide contains Post-It notes that can be used to express any brief thoughts or ideas.
Slide 41: This is the slide to enumerate any additional ideas or realizations from this project by using Post-It notes.
Slide 42: This is a Thank You slide where details such as the address, contact number, and email address are added.
Declining insurance rate in rural areas case competition complete deck with all 42 slides:
Use our Declining Insurance Rate In Rural Areas Case Competition Complete Deck to effectively help you save your valuable time. They are readymade to fit into any presentation structure.


Most Relevant Reviews
-
Great designs, really helpful.
-
Amazing product with appealing content and design.
-
Informative presentations that are easily editable.
-
Best way of representation of the topic.
-
Unique and attractive product design.
-
Easy to edit slides with easy to understand instructions.
-
Best way of representation of the topic.