


Equity Consulting Report Powerpoint Presentation Slides


Try Before you Buy Download Free Sample Product
 Impress Your
 Audience
Editable
of Time


Equity Consulting Report PowerPoint Presentation Slides is a virtual tool for financial analysts to compile their investment research insights. This private financing PPT theme is replete with data visualization tools. Use pie charts, tabular formats, and other kinds of diagrams to present information about the target company’s financial health. Our equity investment analysis PowerPoint slideshow incorporates state of the art design elements. Using this equity valuation PPT presentation you can consolidate a visually-appealing financial ratio analysis. Build a crisp industry overview involving competitive environment analysis and the latest industry trends. Our investment research PowerPoint templates help you to compile valuation analysis using various methods. Risk assessment is another important aspect that you can address with the help of this Equity research PPT slideshow. Elaborate on the types of risks like currency risk, inflation risk, and so on. Private equity consulting even helps you to identify and portray the intensity of each type of risk.
People who downloaded this PowerPoint presentation also viewed the following :
Content of this Powerpoint Presentation
Slide 1: This slide introduces Equity Consulting Report. State your Company name.
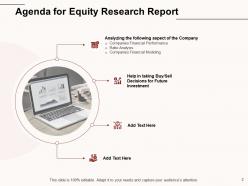
Slide 2: This slide displays Agenda for Equity Research Report.
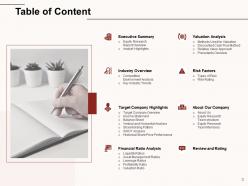
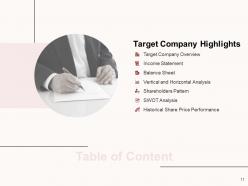
Slide 3: This slide shows Table of Content of the presentation.
Slide 4: This slide depicts Table of Content.
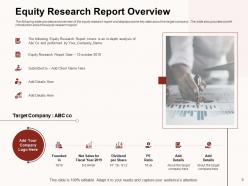
Slide 5: This slide provides and overview of the equity research report and displays some key stats about the target company . The slide also provides a brief Introduction about the equity research report.
Slide 6: This slide is to highlight the process of equity research which starts from Industry analysis and ends with recommendations from the analyst.
Slide 7: This slide displays Table of Content
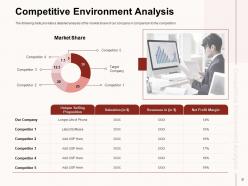
Slide 8: The following slide provides a detailed analysis of the market share of our company in comparison to the competition.
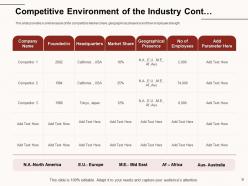
Slide 9: This slide provides a brief analysis of the competitors Market share, geographical presence and their employee strength.
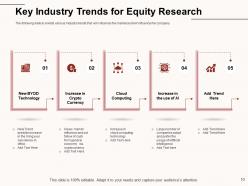
Slide 10: This slide to enlists various Industry trends that will influence the market and will influence the company.
Slide 11: This slide displays Table of Content.
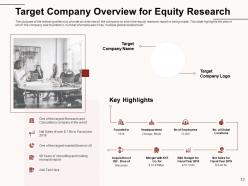
Slide 12: The purpose of the following slide is to provide an overview of the company on which the equity research report is being made.
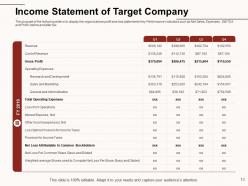
Slide 13: The purpose of this slide is to display the organizations profit and loss statements Key Performance Indicators such as Net Sales, Expenses , EBITDA and Profit before and after tax.
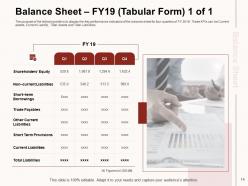
Slide 14: The purpose of the slide is to display the key performance indicators of the balance sheet for four quarters of FY 2019.
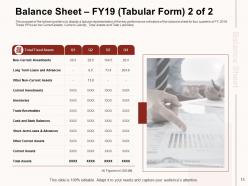
Slide 15: The purpose of the slide is to display a tabular representation of the key performance indicators of the balance sheet for four quarters of FY 2019.
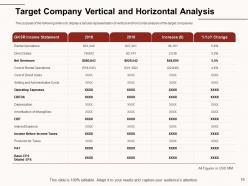
Slide 16: The purpose of the following slide is to display a tabular representation of vertical and horizontal analysis of the target companies .
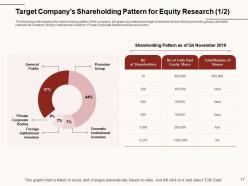
Slide 17: The following slide displays the share holding pattern of the company, the graph provides percentage of shares that are held by promotor groups, domestic institutional investors, foreign Institutional investors, Private Corporate Bodies and General public.
Slide 18: This slide highlights the shareholding pattern of the company, the provided table highlights the shareholders, total number of shares and %age of the same.
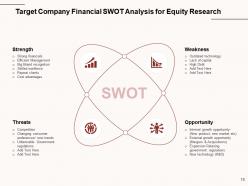
Slide 19: This slide depicts Target Company Financial SWOT Analysis for Equity Research.
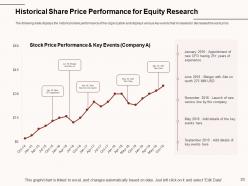
Slide 20: This slide displays the historical share performance of the organization and displays various key events that increased or decreased the sock price.
Slide 21: This slide displays Table of Content displaying- Financial Ratio Analysis, Liquidity Ratios, Asset Management Ratios, Leverage Ratios, Profitability Ratio, Valuation Ratio.
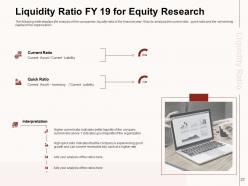
Slide 22: This slide shows Liquidity Ratio FY 19 for Equity Research
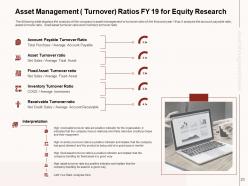
Slide 23: This slide displays the analysis of the company's asset management or turnover ratio of the financial year 19 as it analysis the account payable ratio, asset turnover ratio , fixed asset turnover ratio and inventory turnover ratio.
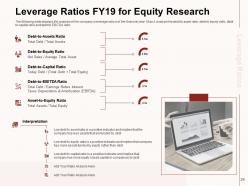
Slide 24: This slide displays the analysis of the company’s leverage ratio o of the financial year 19 as it analysis the debt to asset ratio, debt to equity ratio, debt to capital ratio and debt to EBITDA ratio.
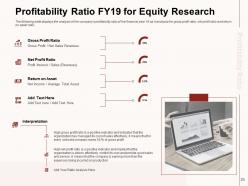
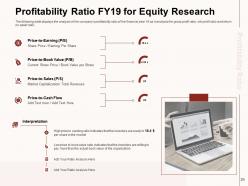
Slide 25: This slide displays the analysis of the company’s profitability ratio of the financial year 19 as it analysis the gross profit ratio, net profit ratio and return on asset ratio.
Slide 26: This slide displays the analysis of the company’s profitability ratio of the financial year 19 as it analysis the gross profit ratio, net profit ratio and return on asset ratio.
Slide 27: This slide displays Table of Content.
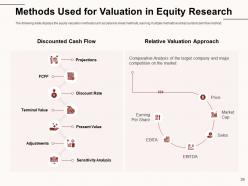
Slide 28: The following slide displays the equity valuation methods such as balance sheet methods, earning multiple methods and discounted cash flow method.
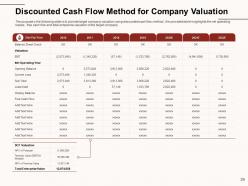
Slide 29: The purpose of the following slide is to provide target company valuation using discounted cash flow method , the provided table hoighlights the net operating losses , free cash flow and total enterprise valuation of the target company.
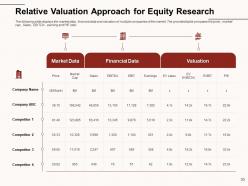
Slide 30: The following slide displays the market data, financial data and valuation of multiple companies of the market. The provided table compares the price , market cap , Sales , EBITDA , earning and P/E ratio.
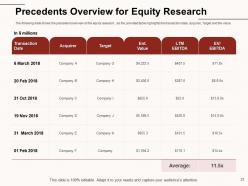
Slide 31: The following slide shows the precedent overview of the equity research, as the provided table highlights the transaction date, acquirer, Target and the value.
Slide 32: This slide shows Table of Content.
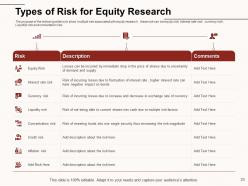
Slide 33: The purpose of the following slide is to show multiple risk associated with equity research, these risk can be equity risk, interest rate risk , currency risk , Liquidity risk and concertation risk .
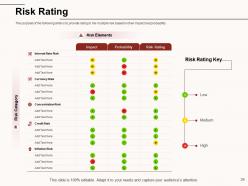
Slide 34: The purpose of the following slide is to provide rating to the multiple risk based on their impact and probability.
Slide 35: This slide displays Table of Content.
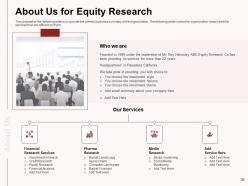
Slide 36: The purpose of the following slide is to provide the overall business summary of the organization. The following slide covers the organization history and the services that are offered by them .
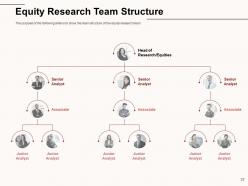
Slide 37: The purpose of the following slide is to show the team structure of the equity research team.
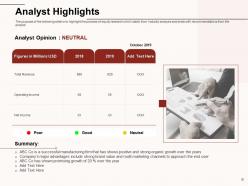
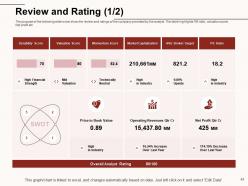
Slide 38: The purpose of the following slide is to show the review and ratings of the company provided by the analyst. The table highlights P/E ratio, valuation score, Net profit . The table also provides weightage average of the same.
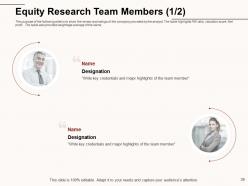
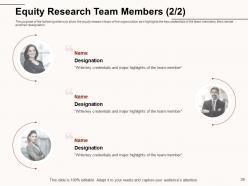
Slide 39: The purpose of the following slide is to show the equity research team of the organization as it highlights the key credentials of the team members, their names and their designation.
Slide 40: This slide shows Table of Content.
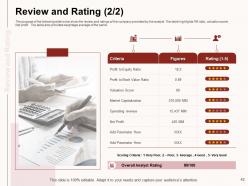
Slide 41: The purpose of the following slide is toe show the review and ratings of the company provided by the analyst. The table highlights P/E ratio, valuation score, Net profit etc.
Slide 42: The purpose of the following slide is toe show the review and ratings of the company provided by the analyst. The table highlights P/E ratio, valuation score, Net profit . The table also provides weightage average of the same.
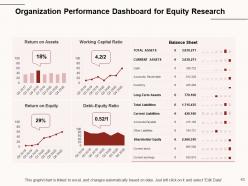
Slide 43: This slide displays Organization Performance Dashboard for Equity Research
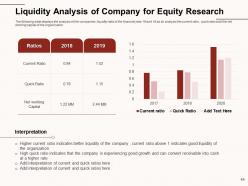
Slide 44: The following slide displays the analysis of the companies liquidity ratio of the financial year 18 and 19 as its analysis the current ratio , quick ratio and the net working capital of the organization.
Slide 45: This is Icons Slide for Equity Consulting Report.
Slide 46: This slide is titled as Additional Slides for moving forward.
Slide 47: This is About Us slide to showcase specifications of the company.
Slide 48: This is Our Mission slide with Mission and Vision.
Slide 49: This is Financial slide to showcase finance related stuff.
Slide 50: This slide shows Targets of the Company.
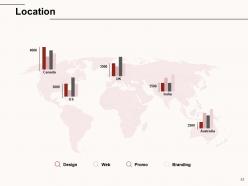
Slide 51: This slide depicts Location.
Slide 52: This is Venn slide.
Slide 53: This slide is titled as Post It Notes. Post your important notes.
Slide 54: This slide displays Timeline process.
Slide 55: This is Idea Generation slide to highlight important facts and ideas.
Slide 56: This is Thank you slide with Contact details.
Equity Consulting Report Powerpoint Presentation Slides with all 56 slides:
Use our Equity Consulting Report Powerpoint Presentation Slides to effectively help you save your valuable time. They are readymade to fit into any presentation structure.


FAQs for Equity Consulting Report
Equity consulting reports typically include executive summaries, demographic analysis, pay gap assessments, advancement opportunity evaluations, and policy review findings. These components work together by identifying disparities across compensation, promotion patterns, and organizational practices, with many companies finding that comprehensive reports enable targeted interventions, enhanced retention strategies, and measurable progress toward workplace equity goals.
Market analysis significantly influences equity consulting recommendations by providing crucial data on industry trends, competitive positioning, valuation benchmarks, regulatory changes, and growth prospects that shape investment strategies. Through comprehensive market evaluation, consultants assess sector dynamics, peer performance comparisons, and emerging opportunities, while identifying potential risks and market inefficiencies, ultimately delivering targeted investment recommendations that align with current market conditions and future outlook.
Equity performance evaluation methodologies include quantitative metrics like return on equity, earnings per share growth, price-to-book ratios, dividend yield analysis, and risk-adjusted returns. These approaches enable consultants to assess portfolio performance, benchmark against market indices, and identify undervalued opportunities, with many financial institutions finding that comprehensive metric combinations deliver more accurate investment insights and strategic positioning advantages.
Regulatory considerations significantly influence equity consulting findings by shaping compliance requirements, disclosure standards, and risk assessment frameworks that organizations must navigate. These regulatory parameters help consultants identify potential legal exposures, recommend strategic adjustments for industry-specific mandates, and ensure findings align with evolving governance standards, ultimately delivering actionable insights that enhance both compliance posture and competitive positioning.
Stakeholder engagement ensures equity consulting reports accurately reflect diverse perspectives, identify systemic barriers, and develop culturally responsive solutions through surveys, focus groups, interviews, and community forums. This collaborative approach enhances report credibility and implementation success, with organizations finding that inclusive stakeholder input leads to more effective equity strategies, stronger buy-in, and sustainable organizational change.
Equity consulting reports help businesses identify investment opportunities by analyzing market trends, financial performance metrics, competitive positioning, and growth potential across various sectors and companies. These comprehensive assessments enable organizations to evaluate risk-adjusted returns, spot undervalued assets, and prioritize strategic investments, with many financial institutions finding that detailed equity analysis streamlines portfolio decisions and enhances long-term profitability.
Key metrics for assessing equity portfolio financial health include return on equity, debt-to-equity ratios, price-to-earnings ratios, dividend yield, and cash flow analysis. These financial indicators enable portfolio managers to evaluate performance, risk exposure, and growth potential across sectors like technology and healthcare, ultimately delivering strategic insights for optimized asset allocation and enhanced long-term returns.
Equity consulting reports incorporate ESG factors through comprehensive risk assessments, sustainability metrics analysis, governance structure evaluations, and stakeholder impact measurements across investment portfolios. These reports enable financial institutions, asset managers, and corporate investors to identify long-term value opportunities, mitigate regulatory compliance risks, and enhance portfolio resilience, ultimately delivering competitive advantage in an increasingly ESG-focused market environment.
Common pitfalls include insufficient stakeholder engagement, relying on outdated demographic data, making broad generalizations without sector-specific context, and failing to provide actionable implementation timelines. These oversights undermine report credibility by creating disconnect between recommendations and organizational realities, with many consulting firms finding that successful equity reports require continuous data validation, cross-departmental input, and measurable milestone frameworks to ensure meaningful organizational change.
Technology enhances equity consulting reports by automating data collection, identifying complex patterns through predictive analytics, and processing vast datasets for real-time insights. AI-powered tools enable consultants to analyze market trends, assess portfolio risks, and generate dynamic visualizations more efficiently, while big data integration delivers deeper sector analysis and competitive intelligence, ultimately providing clients with more accurate, timely, and actionable investment recommendations.
Equity performance frameworks include demographic representation analysis, pay equity audits, advancement trajectory mapping, inclusive leadership assessments, and sector-specific outcome measurements. These benchmarking tools enable organizations to compare progress against industry standards, identify gaps in financial services, healthcare, and technology sectors, while delivering measurable improvements in retention, productivity, and ultimately competitive advantage in increasingly diverse markets.
Geopolitical factors significantly influence equity consulting reports by affecting market volatility, regulatory environments, currency fluctuations, and cross-border investment flows. Through analyzing trade policies, political stability, and international sanctions, consultants help organizations navigate regional risks, identify emerging opportunities, and adjust portfolio strategies, ultimately delivering more resilient investment approaches in an increasingly interconnected global landscape.
Equity consulting reports aid risk management by identifying potential compliance violations, assessing market volatility exposure, evaluating portfolio concentration risks, and highlighting regulatory changes that could impact equity positions. These comprehensive analyses enable financial institutions and investment firms to proactively adjust their strategies, diversify holdings more effectively, and implement stronger governance frameworks, ultimately reducing potential losses while maintaining competitive positioning in increasingly complex markets.
Findings should be communicated through tailored presentations, executive summaries, detailed reports, and interactive workshops designed for each stakeholder group's needs and decision-making authority. Organizations typically present high-level insights to leadership while providing department-specific recommendations to managers, with many finding that multi-format communication strategies enhance buy-in, facilitate implementation, and ultimately drive meaningful organizational change across all levels.
Scenario analysis enables equity consultants to evaluate multiple potential outcomes under varying market conditions, economic environments, and company-specific factors, providing clients with comprehensive risk assessment frameworks. Through stress testing and sensitivity analysis, consulting firms help investors understand how different variables impact equity valuations, ultimately delivering more robust investment strategies and enhanced decision-making capabilities in volatile markets.
-
Really like the color and design of the presentation.
-
Unique design & color.
-
Wonderful templates design to use in business meetings.