
Europe Maps Powerpoint PPT Template Bundles PU Maps


Try Before you Buy Download Free Sample Product
 Impress Your
 Audience
Editable
of Time


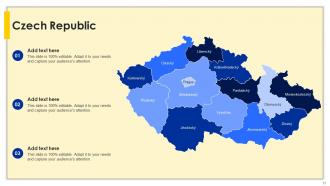
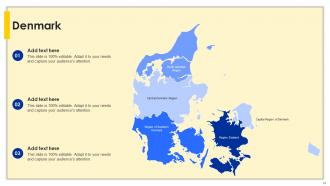
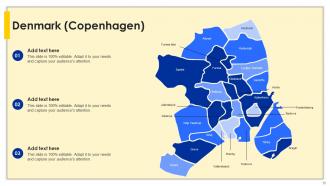
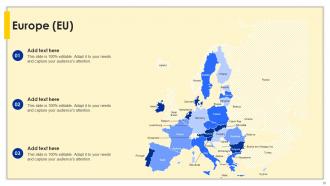
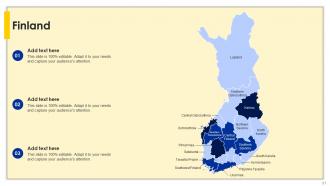
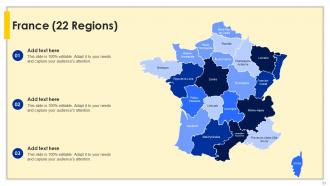
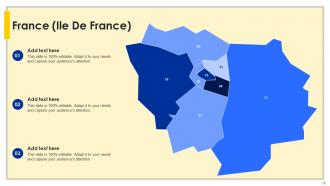
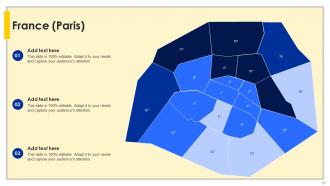
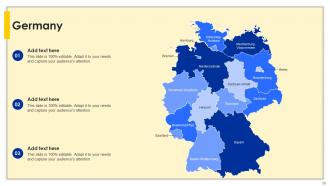
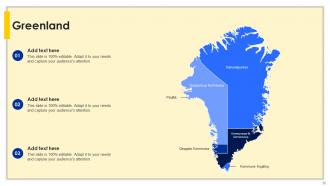
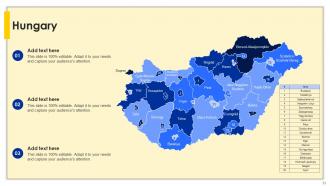
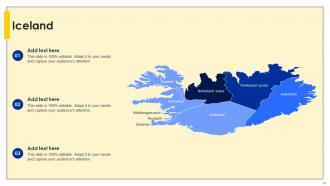
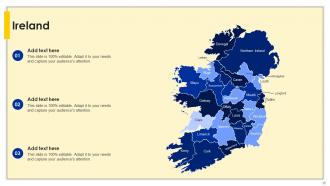
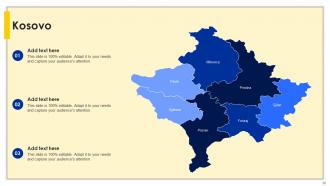
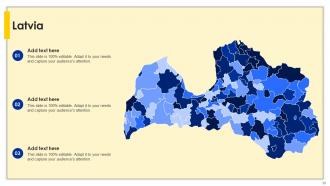
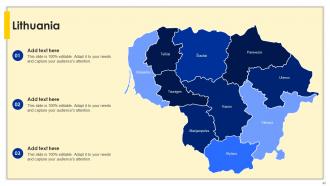
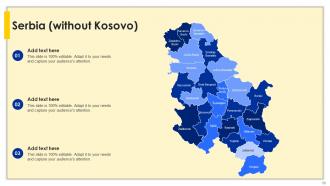
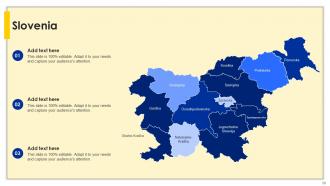
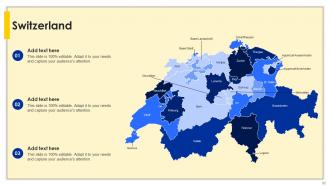
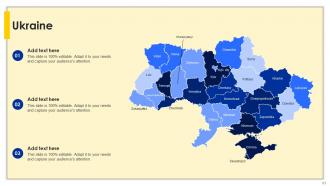
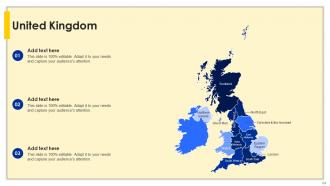
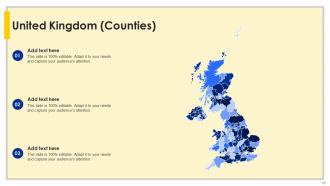
Embark on a comprehensive exploration of Europe with our Europe Maps PowerPoint presentation. Customize your insights with a Blank Map of the United Kingdom, ideal for tailored presentations. Gain a deeper understanding of Ukraines geography through an intricately Outlined Map, capturing the nations diverse regions. Navigate the vast expanse of the Russian Federation with a detailed map, offering insights into its expansive territories. Tailor your presentations with a Blank Map of Latvia, allowing for personalized details. Immerse yourself in the stunning landscapes of Iceland through a thoughtfully crafted map. Elevate your visual storytelling with these meticulously designed maps, providing a rich understanding of Europes varied landscapes and cultural tapestry.
People who downloaded this PowerPoint presentation also viewed the following :
Europe Maps Powerpoint PPT Template Bundles PU Maps with all 75 slides:
Use our Europe Maps Powerpoint PPT Template Bundles PU Maps to effectively help you save your valuable time. They are readymade to fit into any presentation structure.


FAQs for Europe Maps Powerpoint PPT Template
Historical maps of Europe showcase evolving political boundaries, shifting empires, trade route networks, religious territories, and cultural regions that transformed over centuries. These cartographic elements reveal how conquest, diplomacy, and cultural exchange reshaped the continent, with many historians finding that mapping evolution mirrors Europe's complex journey from feudal kingdoms to modern nation-states, ultimately delivering insights into contemporary geopolitical relationships.
Technological advancements have revolutionized European mapping through GPS precision, satellite imagery, GIS systems, digital cartography, and real-time data integration. These technologies streamline urban planning, logistics operations, and tourism services by delivering enhanced accuracy, interactive features, and automated updates, with many European cities finding that smart mapping solutions ultimately reduce operational costs while improving citizen experiences.
Thematic maps visualize complex European data patterns through demographic distributions, economic indicators, political boundaries, migration flows, and resource allocation across regions. These specialized visualizations enable policymakers, researchers, and businesses to identify trends like population density shifts, trade corridors, and regional development disparities, ultimately delivering strategic insights for investment decisions and policy planning.
Geographic information systems enhance European maps by integrating satellite imagery, real-time data collection, GPS coordinates, and layered geographic databases for unprecedented precision and detail. Through advanced mapping technologies, European cartographers deliver dynamic border accuracy, demographic overlays, and infrastructure tracking, while enabling interactive functionality for urban planning, transportation networks, and resource management across diverse regional landscapes.
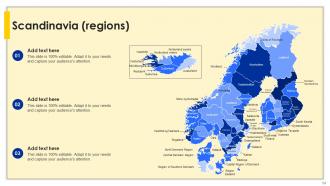
Topographic maps emphasize Europe's physical features like the Alps, Pyrenees, Scandinavian fjords, and river systems, while political maps focus on borders, capitals, and administrative divisions. These geographical insights enable businesses, researchers, and institutions to understand terrain challenges, resource distribution, and infrastructure planning opportunities, with many organizations finding that combining both perspectives delivers strategic advantages for logistics, development projects, and market expansion across diverse European landscapes.
Political boundaries and territorial disputes on Europe maps reveal complex geopolitical tensions, historical conflicts, resource competition, sovereignty challenges, and ethnic divisions across the continent. These visual representations help organizations, diplomatic institutions, and multinational corporations understand regional stability, trade route vulnerabilities, and investment risks, while enabling strategic planning that accounts for evolving political landscapes and cross-border operational considerations.
Climate maps of Europe provide essential data visualization for environmental policymakers by showing temperature patterns, precipitation changes, biodiversity zones, and carbon emission distributions across regions. These detailed geographic insights enable governments and EU institutions to develop targeted sustainability strategies, allocate climate funding effectively, and track progress toward carbon neutrality goals, ultimately delivering evidence-based policy decisions.
European cartographic styles include topographic mapping, thematic visualization, political boundary emphasis, relief shading, and digital interactive formats. These approaches significantly influence viewer interpretation by highlighting different data priorities, with topographic styles emphasizing terrain features for navigation, political maps focusing on administrative boundaries for governance applications, and thematic visualizations enabling demographic and economic analysis across various European institutions and research organizations.
Educational maps of Europe cater to diverse learning by incorporating visual elements, interactive features, color-coded regions, detailed legends, and age-appropriate content complexity. These design approaches enhance comprehension through multiple sensory channels, with elementary schools using simplified graphics while universities leverage detailed demographic data, ultimately delivering improved retention rates and accommodating visual, kinesthetic, and analytical learners across educational institutions.
Tourist maps of European cities commonly feature iconic landmarks like cathedrals, castles, palaces, museums, and historic squares, alongside cultural symbols including national monuments, UNESCO World Heritage sites, and distinctive architectural elements. These visual representations enhance visitor navigation by highlighting must-see attractions, cultural districts, and heritage zones, ultimately delivering enriched travel experiences and helping tourism operators showcase their destinations' unique historical and cultural competitive advantages.
Interactive maps influence tourist behavior by providing real-time information, personalized recommendations, customizable itineraries, and immersive visualizations of European destinations. Through dynamic features like crowd density indicators, weather overlays, and cultural event notifications, travelers make more informed decisions about timing and locations, while tourism boards leverage these insights to distribute visitor traffic more effectively, ultimately enhancing experiences and destination competitiveness.
Historical atlases provide context for contemporary European issues by revealing territorial evolution, ethnic boundaries, migration patterns, economic developments, and political transformations over centuries. Through detailed cartographic analysis, these resources help explain current border disputes, minority populations, regional economic disparities, and cultural tensions, with many policymakers and analysts finding that understanding historical precedents enables more informed decisions regarding EU integration, refugee policies, and diplomatic relations.
Demographic maps inform European policy-making by revealing population density patterns, age distributions, migration trends, employment rates, and income disparities across regions. Through geographic visualization of census data, EU institutions and national governments can strategically allocate healthcare resources, educational funding, and infrastructure investments, while identifying areas requiring targeted economic development, ultimately enabling more equitable and efficient public service delivery.
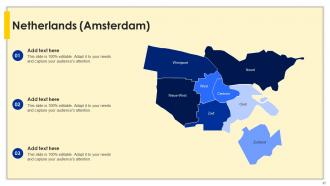
Residents' mental maps emphasize functional spaces like neighborhoods, workplaces, and daily routes, while tourists focus on landmarks, cultural sites, and entertainment districts. These contrasting perspectives reflect different spatial priorities, with residents navigating practical infrastructure and tourists seeking experiential destinations, ultimately creating complementary views that enhance urban planning strategies across European cities like Barcelona, Amsterdam, and Prague.
Ethical considerations in Europe map representation include territorial dispute neutrality, historical accuracy regarding contested regions, minority population visibility, colonial legacy acknowledgment, and cultural sensitivity in boundary depictions. These considerations enable cartographers to balance political complexities with educational value, with many academic institutions and international organizations finding that transparent, multi-perspective approaches ultimately enhance credibility and foster more informed geopolitical understanding.
-
I am so thankful for all of the templates I've found on your site. They have saved me hours every week and helped make my presentations come alive. Keep up with these amazing product releases!
-
SlideTeam makes creating presentations easy. Unlimited products, premium quality designs and affordable.