


Fastest inorganic growth with strategic alliances powerpoint presentation slides


Try Before you Buy Download Free Sample Product
 Impress Your
 Audience
Editable
of Time


Our fastest inorganic growth with strategic alliances PPT template explains new strategies to increase sales, output, and business reach through mergers, acquisitions, and takeovers of new businesses. It talks critically about expanding your organization by engaging in internal activities that increase revenue. SlideTeam has designed this inorganic growth strategy PPT theme that discusses the risks, failures, and benefits of inorganic growth. Our swift inorganic growth model PPT slideshow is structured on meticulous research that translates key insights into multiple substantial topics, including company acquisition details, sales details, and SWOT analysis. This inorganic growth process PPT theme further explains the different modes and strategies your company can employ to accelerate inorganic growth. Besides this, you also get an overview of key statistics and financial details necessary to target your potential growth. Grab this complete deck presentation and make it your own. Download our inorganic growth with strategic alliances PPT set today.
People who downloaded this PowerPoint presentation also viewed the following :
Content of this Powerpoint Presentation
Slide 1: This slide is titled “Fastest Inorganic Growth with Strategic Alliances.” State your company name and get started.
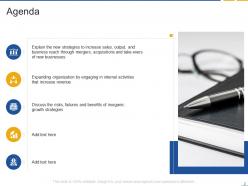
Slide 2: This slide is titled “Agenda.” Use this slide to explain the new strategies to increase sales, output, and business reach through mergers, and acquisitions, and take-overs of new businesses
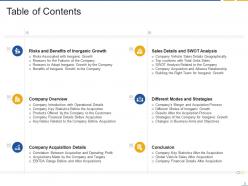
Slide 3: This slide is titled “Table of Contents.” It shows the Risks and Benefits of Inorganic Growth, Company Overview, Company Acquisition Details, etc.
Slide 4: This slide is titled “Table of Contents.” It shows the Risks and Benefits of Inorganic Growth, Risks Associated with Inorganic Growth, Reasons for the Failures of the Company, etc.
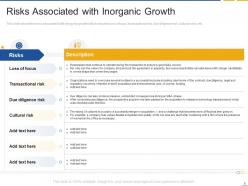
Slide 5: This slide is titled “Risks Associated with Inorganic Growth.” It shows the risks associated with inorganic growth which include loss of focus, transactional risk, due diligence risk, cultural risks, etc.
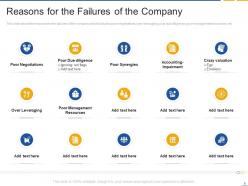
Slide 6: This slide is titled “Reasons for the Failures of the Company.” It shows the reasons for the failures of the company which include poor negotiations, over leveraging, poor due diligence, poor management resources, etc.
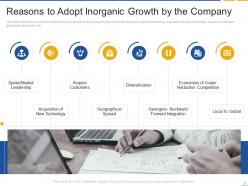
Slide 7: This slide is titled “Reasons to Adopt Inorganic Growth by the Company.” It shows the reasons to adopt inorganic growth by the company which includes speed to market leadership, acquisition of new technology, acquiring customers, geographical spread, etc.
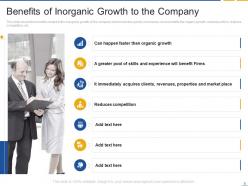
Slide 8: This slide is titled “Benefits of Inorganic Growth to the Company.” It shows the benefits related to the inorganic growth of the company which includes quick occurrence, more benefits the organic growth, market position, reduced competition, etc.
Slide 9: This slide is titled “Table of Contents.” It shows Company Overview, Company Introduction with Operational Details, Company Key Statistics Before the Acquisition, Products Offered by the Company to the Customers, etc.
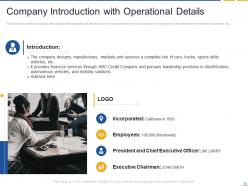
Slide 10: This slide is titled “Company Introduction with Operational Details.” It shows the company introduction with operational details such as incorporated year, the total number of employees, president name, executive chairman, etc.
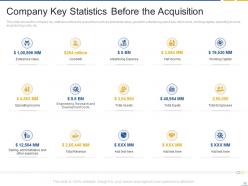
Slide 11: This slide is titled “Company Key Statistics Before the Acquisition.” It shows the company key statistics before the acquisition such as enterprise value, goodwill, advertising expenses, net income, working capital, operating income, engineering costs, etc.
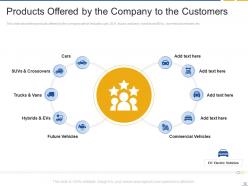
Slide 12: This slide is titled “Products Offered by the Company to the Customers.” It shows the products offered by the company which includes cars, SUVs, trucks, and vans, hybrids and EVs, commercial vehicles, etc.
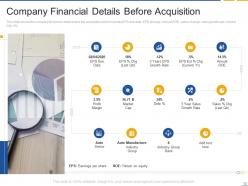
Slide 13: This slide is titled “Company Financial Details Before Acquisition.” It shows the company financials detail before the acquisition which includes EPS due date, EPS change, Annual ROE, sales change, sales growth rate, market cap, etc.
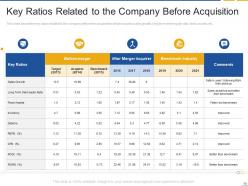
Slide 14: This slide is titled “Key Ratios Related to the Company Before Acquisition.” It shows the key ratios related to the company before the acquisition which includes sales growth, long-term debt-equity ratio, fixed assets, etc.
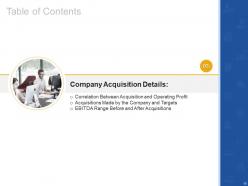
Slide 15: This slide is titled “Table of Contents.” It shows Company Acquisition Details, Correlation Between Acquisition and Operating Profit, Acquisitions Made by the Company and Targets, etc.
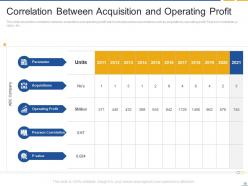
Slide 16: This slide is titled “Correlation Between Acquisition and Operating Profit.” It shows the correlation between acquisition and operating profit which includes various parameters such as acquisitions, operating profit, Pearson correlation, p-value, etc.
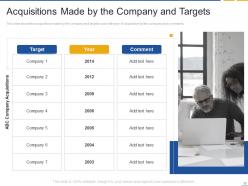
Slide 17: This slide is titled “Acquisitions Made by the Company and Targets.” It shows the acquisitions made by the company and targets such as the year of acquisition by the company and comments.
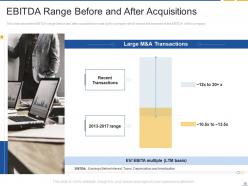
Slide 18: This slide is titled “EBITDA Range Before and After Acquisitions.” It shows the EBITDA range before and after acquisitions made by the company which shows the increase in the EBITDA of the company.
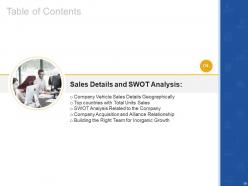
Slide 19: This slide is titled “Table of Contents.” It shows Sales Details and SWOT Analysis: Company Vehicle Sales Details Geographically, Top countries with Total Units Sales, SWOT Analysis Related to the Company, etc.
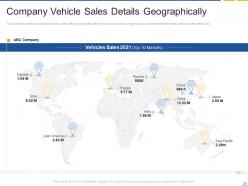
Slide 20: This slide is titled “Company Vehicle Sales Details Geographically.” It shows the company vehicle sales details geographically which shows various regions and countries with their total vehicle sales detail, etc.
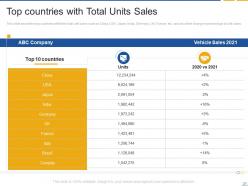
Slide 21: This slide is titled “Top countries with Total Units Sales.” It shows the top countries with their total unit sales such as China, USA, Japan, India, Germany, UK, France, etc.
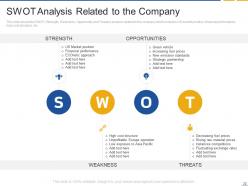
Slide 22: This slide is titled “SWOT Analysis Related to the Company.” It shows the SWOT (Strength, Weakness, Opportunity, and Threats) analysis related to the company which includes US market position, financial performance, high-cost structure, etc.
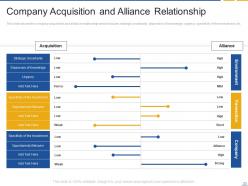
Slide 23: This slide is titled “Company Acquisition and Alliance Relationship.” It shows the company acquisition and alliance relationship which includes strategic uncertainty, dispersion of knowledge, urgency, specificity of the investment, etc.
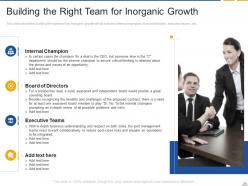
Slide 24: This slide is titled “Building the Right Team for Inorganic Growth.” It shows the building the right team for inorganic growth which includes internal champions, board of directors, executive teams, etc.
Slide 25: This slide is titled “Table of Contents.” It shows Different Modes and Strategies, the Company’s Merger and Acquisition Process, Different Modes of Inorganic Growth, Results After the Acquisition Process, etc.
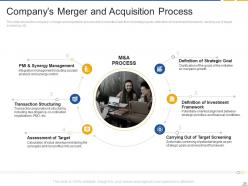
Slide 26: This slide is titled “Company’s Merger and Acquisition Process.” It shows the company’s merger and acquisition process which includes the Definition of strategic goals, the definition of investment framework, carrying out-of-target screening, etc.
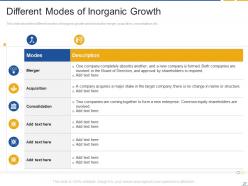
Slide 27: This slide is titled “Different Modes of Inorganic Growth.” It shows the different modes of inorganic growth which includes a merger, acquisition, consolidation, etc.
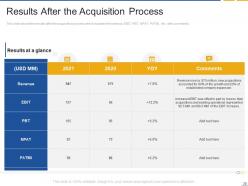
Slide 28: This slide is titled “Results After the Acquisition Process.” It shows the results after the acquisition process which includes the revenue, EBIT, PBT, NPAT, PATMI, etc.
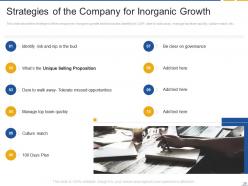
Slide 29: This slide is titled “Strategies of the Company for Inorganic Growth.” It shows the strategies of the company for inorganic growth which include identifying risk, USP, daring to walk away, managing top team quickly, culture match, etc.
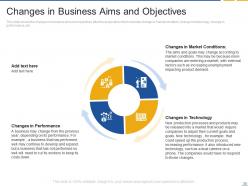
Slide 30: This slide is titled “Changes in Business Aims and Objectives.” It shows the changes in business aims and objectives after the acquisition which includes a change in market condition, change in technology, change in performance, etc.
Slide 31: This slide is titled “Table of Contents.” It includes Conclusion, Company Key Statistics After the Acquisition, Global Vehicle Sales After Acquisition, and Company Financial Details After Acquisition.
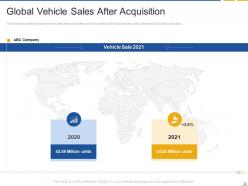
Slide 32: This slide is titled “Global Vehicle Sales After Acquisition.” It shows the global vehicle sales after acquisition which includes 2019 total vehicle units' sales and 2020 total unit sales.
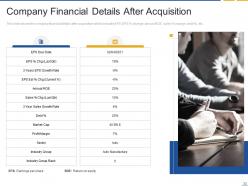
Slide 33: This slide is titled “Company Financial Details After Acquisition.” It shows the company financial details after acquisition which includes EPS, EPS % change, annual ROE, sales % change, debt %, etc.
Slide 35: This slide is titled “Additional Slides.”
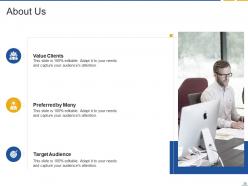
Slide 36: This slide contains the information about the company aka the ‘About Us’ section. This includes the Value Clients, the Target Audience, and Preferred by Many.
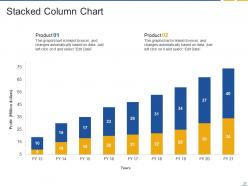
Slide 37: This slide is titled “Stacked Bar.” This slide shows a bar graph that compares 2 products’ sales over a timeline of financial years.
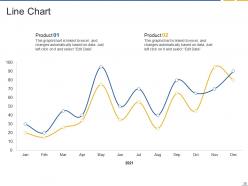
Slide 38: This slide is titled “Line Chart.” Compare your products here.
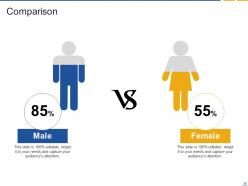
Slide 39: This slide presents a comparison between Men and Women.
Slide 40: This slide is the Idea Generation slide. It is used to brainstorm ideas for a project.
Slide 41: This slide provides a Venn diagram that can be used to show interconnectedness and overlap between various departments, projects, etc.
Slide 42: This slide is titled “Puzzle.” You can use this template to display your product or an idea implementation technique.
Slide 43: This slide is titled “Our Goal.” Add your long-term and short-term goals to this template.
Slide 44: This slide contains Post-It Notes that can be used to express any brief thoughts or ideas.
Slide 45: This slide is titled “Timeline”. It showcases the progress of the steps of a project with time.
Slide 46: This is a Thank You slide where details such as the address, contact number, and email address are added.
Fastest inorganic growth with strategic alliances powerpoint presentation slides with all 46 slides:
Use our Fastest Inorganic Growth With Strategic Alliances Powerpoint Presentation Slides to effectively help you save your valuable time. They are readymade to fit into any presentation structure.


-
Good research work and creative work done on every template.
-
Great quality slides in rapid time.
-
Great product with effective design. Helped a lot in our corporate presentations. Easy to edit and stunning visuals.
-
Great quality slides in rapid time.