


Finance Metrics Powerpoint Ppt Template Bundles





Try Before you Buy Download Free Sample Product
 Impress Your
 Audience
 100%
100% Editable
 Save Hours
 of Time


Our Finance Metrics Powerpoint Ppt Template Bundles are topically designed to provide an attractive backdrop to any subject. Use them to look like a presentation pro.
People who downloaded this PowerPoint presentation also viewed the following :
Finance Metrics Powerpoint Ppt Template Bundles with all 24 slides:
Use our Finance Metrics Powerpoint Ppt Template Bundles to effectively help you save your valuable time. They are readymade to fit into any presentation structure.







FAQs for Finance Metrics Powerpoint
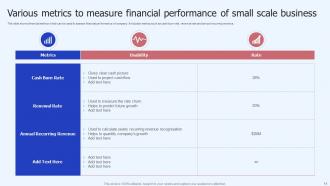
Key finance metrics every startup should track include cash flow, burn rate, runway, customer acquisition cost (CAC), lifetime value (LTV), and monthly recurring revenue (MRR). These metrics enable founders to monitor financial health, optimize resource allocation, and demonstrate growth potential to investors, with many startups finding that consistent tracking delivers better funding outcomes and operational efficiency.
Different finance metrics influence business decision-making by providing quantitative insights into profitability, liquidity, efficiency, and growth potential across various operational areas. Through ROI analysis, cash flow assessments, and debt-to-equity ratios, companies streamline resource allocation, optimize investment strategies, and enhance operational efficiency, with many organizations finding that integrated metric dashboards ultimately deliver faster strategic responses and competitive advantage.
The current ratio and quick ratio are essential liquidity metrics that measure a company's ability to meet short-term obligations, with current ratio including all current assets while quick ratio excludes inventory and prepaid expenses. These ratios enable financial analysts, investors, and management to assess operational efficiency and cash flow stability, with banks and creditors particularly relying on these measurements when evaluating loan applications, ultimately delivering insights into financial health and competitive positioning.
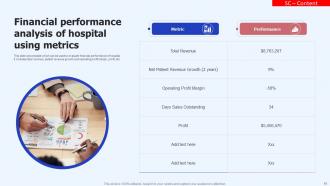
Finance metrics play a crucial role in measuring profitability by tracking gross profit margins, net profit ratios, return on assets, earnings per share, and operating income percentages. These indicators enable management teams, investors, and stakeholders to assess financial performance, identify operational efficiency trends, and make strategic decisions, with many organizations finding that consistent metric monitoring ultimately delivers improved resource allocation and competitive positioning.
ROI is calculated by dividing net profit by total investment cost, then multiplying by 100 for percentage, while considering timeframe, opportunity costs, and risk factors for comprehensive analysis. Financial teams across sectors like retail and manufacturing enhance accuracy by including indirect costs, depreciation, and market variables, ultimately delivering strategic insights that guide resource allocation and competitive investment decisions.
Cash flow analysis is critical because it reveals actual liquidity, operational efficiency, and financial sustainability beyond what profit statements show. Through tracking cash inflows and outflows, businesses identify potential shortfalls, optimize working capital management, and make informed investment decisions, with many organizations finding that strong cash flow analysis enables strategic growth opportunities while minimizing financial risks.
Gross profit margin measures revenue minus cost of goods sold, while net profit margin accounts for all expenses including operating costs, taxes, and interest. Gross margin helps retailers and manufacturers assess production efficiency, whereas net margin provides investors and stakeholders with complete profitability insights, ultimately delivering comprehensive financial transparency for strategic decision-making.
Finance metrics help forecast future financial performance by analyzing historical trends, identifying seasonal patterns, evaluating cash flow cycles, and assessing growth trajectories across key indicators. These metrics enable organizations to predict revenue fluctuations, anticipate funding needs, and optimize resource allocation, with many financial institutions finding that comprehensive metric analysis delivers more accurate projections and strategic competitive advantage.
Leverage ratios reveal a company's debt management, solvency risk, and capital structure efficiency by measuring debt-to-equity relationships, interest coverage capabilities, and asset-to-liability proportions. These metrics enable investors, lenders, and management to assess financial stability, creditworthiness, and growth sustainability, with many financial institutions finding that balanced leverage ratios indicate stronger operational resilience and strategic flexibility.
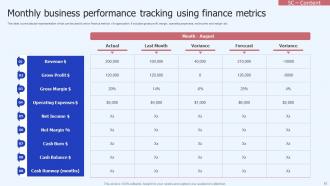
Essential finance metrics for budget management include variance analysis, cash flow ratios, budget-to-actual comparisons, expense ratios, and return on investment calculations. These metrics streamline financial oversight by identifying spending patterns, forecasting cash needs, and optimizing resource allocation, with many organizations finding that consistent monitoring ultimately delivers improved profitability and strategic decision-making capabilities.
Benchmarking finance metrics against industry standards reveals competitive positioning, identifies performance gaps, and highlights improvement opportunities across profitability, liquidity, and efficiency measures. This strategic comparison enables organizations to set realistic targets, prioritize resource allocation, and adapt best practices from top performers, ultimately delivering enhanced operational efficiency and sustainable competitive advantage in their market.
A declining debt-to-equity ratio typically indicates improved financial stability, reduced financial risk, and enhanced borrowing capacity for future growth initiatives. This trend strengthens business sustainability by lowering interest expenses, increasing operational flexibility, and attracting investors, with many companies finding that reduced leverage enables strategic reinvestment and competitive positioning.
Finance metrics assist in evaluating operational efficiency by measuring cost per unit, cycle times, resource utilization rates, and productivity ratios across different business functions. Through tracking these indicators, organizations can identify bottlenecks, optimize resource allocation, and benchmark performance against industry standards, with many companies finding that data-driven insights ultimately deliver significant cost reductions and streamlined operations.
Key finance metrics for long-term investment potential include return on equity, debt-to-equity ratio, free cash flow growth, profit margins, and revenue consistency. These indicators help investors assess financial stability, management efficiency, and growth sustainability, with many institutional investors finding that companies demonstrating strong cash generation and controlled leverage ultimately deliver superior long-term returns.
Analyzing finance metrics aids risk management by evaluating debt-to-equity ratios, liquidity positions, cash flow patterns, and profitability trends to identify potential vulnerabilities before they become critical issues. These assessments enable investors to diversify portfolios strategically, adjust position sizes, and make informed decisions about asset allocation, ultimately delivering enhanced risk-adjusted returns and competitive advantage.
-
Crisp and neat slides. Makes it fun and easier to curate presentations.
-
SlideTeam offers so many variations of designs and topics. It’s unbelievable! Easy to create such stunning presentations now.