


Google Search Console What Is It And How To Use It Edu Ppt




Try Before you Buy Download Free Sample Product
 Impress Your
 Audience
 100%
100% Editable
 Save Hours
 of Time


This set of slides highlights the working of Google Search Console Formerly Webmasters and how it helps developers, website owners, and SEO professionals understand traffic and errors through metrics. The slides deck covers the multiple components of software performance tabs, aggregating data by property vs. by page, page experiences, etc.
People who downloaded this PowerPoint presentation also viewed the following :
Content of this Powerpoint Presentation
Slide 1
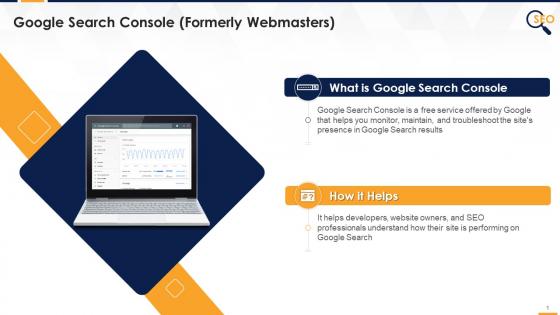
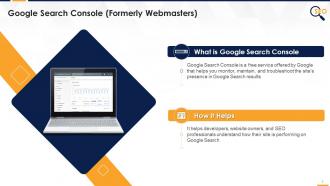
This slide covers a brief introduction about the google search console, formerly known as webmasters, and how it helps developers, website owners, and SEO professionals understand traffic and errors through metrics.
Slide 2
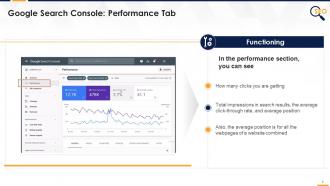
This slide covers google search console performance section details such as total clicks, impressions, average CTR, positioning, etc.
Instructor's Notes:
- The Performance report displays critical metrics about your site's performance in Google Search results, such as how frequently it appears, its average position in search results, click-through rate, and any unique features connected with your results
- Use this information to improve your site’s search performance. For example:
- Examine how your search traffic evolves, where it starts, and which search phrases will likely lead to your site
- Discover which inquiries are done on smartphones and utilize this information to enhance your mobile targeting
- See which pages in Google search results have the greatest (and lowest) click-through rate
Slide 3
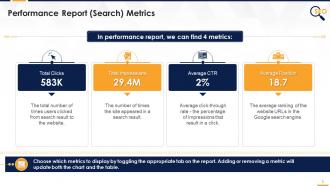
This slide covers a description of webmaster performance report metrics. It depicts The total number of times users clicked on a website, the number of times the site appeared in the search result, the average click-through rate, and an average ranking of the website URLs in the Google search engine.
Slide 4
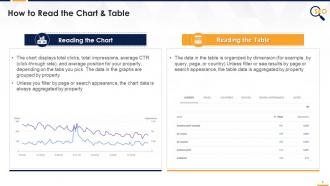
This slide covers how a user can read charts and tables in the google search console. It also depicts that Unless users filter by page or search appearance, the chart data, as well as table data, will always be aggregated by property
Instructor's Notes:
*Property here means website
For charts
- The most recent data may be preliminary; preliminary data is shown on the chart when you click or select it
- The graph provides the totals for each metric. The totals on the chart may differ from the totals on the table
- To understand the numbers, look at dimensions, metrics, and the data
For table
- For a variety of reasons, the chart totals can differ from the table totals
- To understand the numbers, look at dimensions and, metrics
Why did the report table disappear?
The table is excluded from the report if it does not provide any new information to the chart
Slide 5
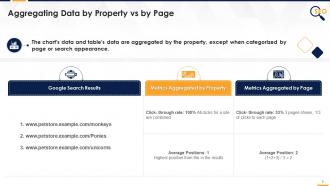
This slide covers details about how The chart's and table's data are aggregated by the property, except when categorized by page or search appearance.
Slide 6
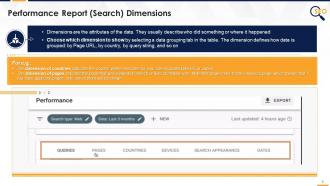
This slide covers introduction about webmaster dimensions. It also depicts there are the six types of dimension filters in this report such as queries, pages, countries, devices, search appearance, and date.
Instructor's Notes:
- Optionally Filter your data by inserting or removing filters
- Optionally Compare dimension groupings, such as findings from Brazil and China, or image data vs. online data
Slide 7
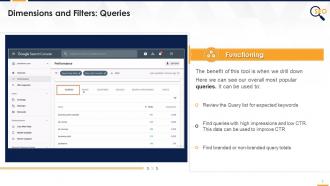
The slide covers details about queries filter such as its functioning, common uses and difference between branded and non-branded queries
Instructor's Notes:
- These are the query strings that people typed into Google. Only query strings that returned your site that were not anonymized are displayed
- To preserve the user's anonymity initiating the query, very uncommon searches (referred to as anonymized queries) are not displayed in these results. Anonymized searches are never included in the table
- Anonymized queries are included in chart totals unless you filter by a query (either queries containing or queries not containing a given string)
Common uses:
- Review the Query list for expected keywords - if keywords you wish to see don't appear, your site might not have enough valuable content relevant to those keywords
- If unexpected words (like "hotels" or "casino") appear, your site has likely been hacked
- These searches can assist you in determining where you can modify your titles and snippets to fit your users' interests better
Branded and non-branded
- Branded queries – visitors are searching for the brand directly
- Non-branded queries – visitors aren't searching for your brand specifically, but are looking for what your site offers
Slide 8
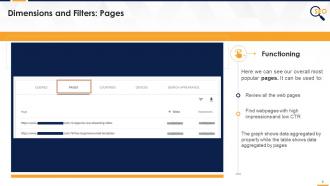
This slide covers details about pages filter. It also depicts that performance report assigns data to the page's canonical URL, not to a duplicate URL.
Instructor's Notes:
This performance report assigns data to the page's canonical URL, not to a duplicate URL. It means that when a user clicks an identical URL in Search results, the click counts for the canonical URL, not the URL that the user visits. Therefore, the Performance report can show zero clicks for a duplicate URL even though your site logs show users reached that page from Google Search.
Slide 9
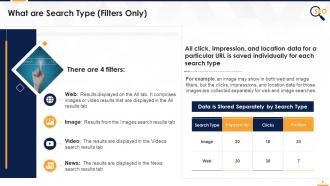
This slide covers types of filters in performance report such as search type wed, images, videos, news etc.
Instructor's Notes:
Because the results page layout for different filters is so diverse, grouping is not supported for search type. For example, position 30 in images search results may be on the first result page, whereas position 30 in online search would be on page three.
Slide 10
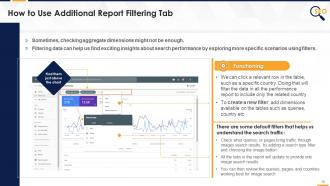
This slide covers detail instructions to use additional report filter in webmaster. It also includes some default filters that help us understand the search traffic such as queries, search types, pages, countries, etc.
Slide 11
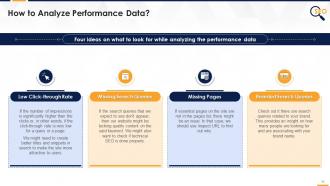
This slide covers four ways to analyze performance data such as Low click-through rate, Missing search queries, missing pages and branded search queries.
Slide 12
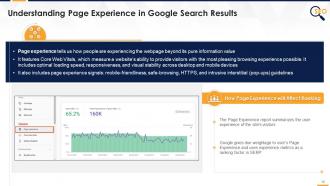
This slide covers details regarding page experience tab in webmaster. It also depicts how people are experiencing the webpages other than the content on the site.
Instructor's Notes:
What are page experience signals?
- Page experience is a collection of signals/metrics that assess how people perceive the experience of engaging with a webpage beyond its pure information value
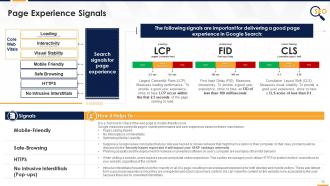
- It features Core Web Vitals, a collection of metrics that evaluate real-world user experience for page loading performance, interaction, and visual stability
Slide 13
This slide covers search signals for page experience largely known as core web vitals. It also includes KPIs such as mobile-friendly experience, safe browsing experience, HTTPS security and no intrusive interstitials.
Additional Slide 1
This slide contains icons related to Search Engine Optimization (SEO). The slide uses the same color theme and similar design elements as the main deck.
Additional Slide 2
This slide can be edited to provide information about one's organization. The slide uses the same color theme and similar design elements as the main deck.
Additional Slide 3
This editable slide can be used to share the organization's vision, mission, and goals. The slide uses the same color theme and similar design elements as the main deck.
Additional Slide 4
This slide can be edited to provide information about the organization's core team. The slide uses the same color theme and similar design elements as the main deck.
Additional Slide 5
This slide can be used to present multiple discussion ideas to the stakeholders concerned.
Additional Slide 6
This slide contains an editable 30-60-90-day plan to suit the presenter's needs.
Additional Slide 7
This slide contains a timeline to showcase multiple milestones of the organization.
Additional Slide 8
This slide contains a roadmap template for effective strategic planning. The slide uses the same color theme and similar design elements as the main deck.
Additional Slide 9
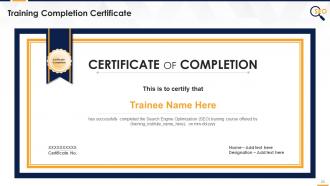
This fully editable training certificate template can be presented to attendees post the successful completion of training.
Google Search Console What Is It And How To Use It Edu Ppt with all 28 slides:
Use our Google Search Console What Is It And How To Use It Edu Ppt to effectively help you save your valuable time. They are readymade to fit into any presentation structure.








FAQs for Google Search Console What Is It And How To Use
Oh dude, you need Google Search Console! It's this free tool that shows exactly how your site's doing in search results. I was skeptical at first but it's actually clutch. You can see what keywords people use to find you, track your rankings, and catch technical problems before they tank your SEO. Plus it sends you alerts when something breaks - saved my butt a few times honestly. The data on which pages get clicked most is pretty eye-opening too. Definitely connect your site if you haven't yet. Takes like 5 minutes and the insights are solid gold.
So there are a few ways to verify ownership in Google Search Console. HTML file upload is probably your best bet if you can access your server - just download their verification file and stick it in your root directory, then hit verify. You could also add a meta tag to your homepage header instead. DNS verification works too if you handle your own domain settings (though honestly that one's a bit more technical). There's also Google Analytics or Tag Manager options. Just pick whatever matches how much server access you actually have. Once it's verified, you're all set to start tracking your search stuff.
Focus on Performance reports first - that's where you'll see clicks, impressions, CTR, all the good stuff. Coverage reports are huge too since they catch indexing problems. URL Inspection tool is perfect when you need to troubleshoot specific pages. Oh, and don't sleep on Core Web Vitals and Mobile Usability - Google cares about that now. Sitemaps section is boring but you gotta submit them. Honestly? I'm in Performance and Coverage like 80% of the time. They're where you find the easy wins. Set up email alerts for critical issues so you're not logging in every day to check.
Think of Google Search Console as your website's doctor - it catches stuff you'd totally miss on your own. Crawling errors, slow pages, mobile problems that tank your rankings. The Core Web Vitals thing is actually pretty solid for pinpointing where your user experience sucks. It'll also spot indexing issues early, which honestly saves you from bigger headaches later. I usually peek at the Performance and Experience tabs once a week (okay, sometimes I forget). But when I do check, it's like having a to-do list of exactly what's broken and needs fixing first.
Honestly, Google Search Console is a lifesaver for catching mobile issues before they tank your site. You'll see problems like tiny text or buttons crammed together - the kind of stuff that makes people bounce immediately. The Mobile Usability report breaks down exactly what's broken on which pages, so no more guessing games. I usually check mine weekly (okay, sometimes I forget but whatever). Focus on fixing the pages that actually get mobile traffic first. Watching those red errors disappear as you fix things? Pretty satisfying, not gonna lie.
Check out the Performance report in Search Console - super helpful tool. Go to Performance > Search results and you'll see all the search terms driving traffic to your site. Shows impressions, clicks, CTR, and where you rank. Filter by specific pages or date ranges to dig deeper. Honestly the best part is discovering random long-tail keywords you're ranking for without even trying. I usually peek at it weekly and download the data to spot trends. Sometimes I get distracted looking at weird search queries people used to find my site though lol.
So the Coverage report basically shows you what Google can and can't see on your site. Four main categories: indexed pages (good), pages with warnings, error pages that won't get indexed at all, and excluded stuff. Honestly, focus on those error pages first - they're completely invisible to anyone searching right now which sucks. I check mine maybe once a week? The excluded pages aren't always bad though, sometimes Google just decides certain pages aren't worth it. But yeah, this report's super helpful for understanding why your traffic might be tanking.
So Google Search Console has this "Links" report on the left side that's pretty solid for seeing who's linking to you. Way better than those sketchy third-party tools honestly. You'll see your top linking sites, which pages get the most links, plus what anchor text people are using. The data comes straight from Google's crawls so it's legit. Monthly checks are good for catching new backlinks - sometimes you'll spot spammy ones that could tank your rankings. Those you can disavow if needed. Been using it for years and it's saved me from some really questionable link farms.
Go to the Sitemaps section and paste your sitemap URL - usually yoursite.com/sitemap.xml or whatever. Hit submit, but definitely check it's actually working first. Getting a 404 error there is just awkward. Your sitemap needs to stay under 50MB and 50,000 URLs max. I always run it through Google's testing tool beforehand because why deal with headaches later? Large sites should break things up into separate sitemaps for different content types. Oh, and circle back periodically to check for errors or coverage problems that might've popped up.
Go to Security & Manual Actions and check out the Security Issues report. It'll show you exactly what Google found - malware, sketchy content, whatever. Way better than trying to figure it out yourself, honestly. Each issue comes with the affected URLs and actual steps to fix it. After you clean everything up, you can request a review right there in the console. Oh, and definitely turn on email alerts. Trust me on this one - finding out about security problems three weeks late is the worst.
So the Performance report basically shows you how your site shows up in Google searches. You can see what people are searching for to find you, where you rank for different keywords, and your click-through rates. I spend way too much time in there honestly. The cool part is you can filter by pages, countries, devices - really dig into the data. Look for queries where you're getting tons of impressions but barely any clicks. Those are perfect for tweaking your titles and descriptions to get more people actually clicking through to your site.
So Google Search Console is your best friend for this stuff. Check out the Rich Results report first - it shows what's already working on your site. The URL Inspection tool is pretty handy too. You can spot errors that mess up your rich snippets and test how Google actually reads your schema markup. Oh, and the Enhancements section breaks everything down by type like recipes or products, which honestly makes life way easier. When things break, you'll get specific error messages. You can even validate fixes before resubmitting them.
So Search Console is all about your Google rankings - what keywords are driving traffic, where you show up in results, plus it catches technical problems like crawl errors. Analytics is different though, it tracks everything visitors do once they're actually on your site. I always think of it like this: Search Console = how people find you, Analytics = what happens after they arrive. Both are free so honestly just grab them both? They work way better together anyway. Oh and the data doesn't overlap much, so you're not getting redundant info.
So the URL Inspection tool is basically your best friend for checking how Google actually sees your pages. Copy/paste any URL and boom - you get real-time info on indexing status, mobile issues, structured data problems, all that stuff. Most people totally ignore this feature which is kinda crazy since it's so useful. You can request indexing right from there too when you publish something new. Oh and it shows you exactly how Googlebot renders your page, which honestly can be eye-opening sometimes. I always check it after fixing technical stuff or publishing new content.
Okay so first thing - double check you're in the right property because I've wasted SO much time looking at the wrong domain version (like www vs non-www). Also the data's always 2-3 days behind, so don't freak out over sudden drops. Check your dates first! Coverage report is clutch though - catch indexing problems early before they mess with your rankings. Oh and skip obsessing over total impressions. That stuff's basically meaningless. Focus on CTR and average position for pages that actually drive business results instead.
-
Informative presentations that are easily editable.
-
Great product with highly impressive and engaging designs.