
Graph Illustrating Impact Of Prescriptive Unlocking The Power Of Prescriptive Data Analytics SS


Try Before you Buy Download Free Sample Product
 Impress Your
 Audience
Editable
of Time


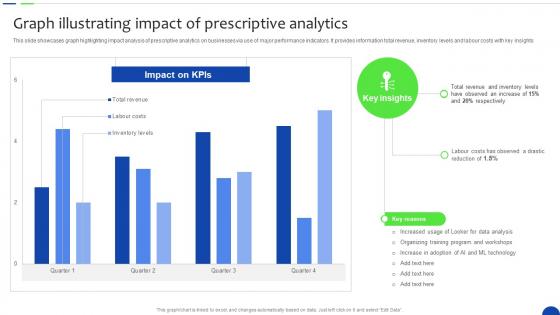
This slide showcases graph highlighting impact analysis of prescriptive analytics on businesses via use of major performance indicators. It provides information total revenue, inventory levels and labour costs with key insights.
This slide showcases graph highlighting impact analysis of prescriptive analytics on businesses via use of major performance indicators. It provides information total revenue, inventory levels and labour costs with key insights. Deliver an outstanding presentation on the topic using this Graph Illustrating Impact Of Prescriptive Unlocking The Power Of Prescriptive Data Analytics SS. Dispense information and present a thorough explanation of Labour Costs, Revenue And Inventory Levels, Training Program And Workshops using the slides given. This template can be altered and personalized to fit your needs. It is also available for immediate download. So grab it now.
People who downloaded this PowerPoint presentation also viewed the following :
Graph Illustrating Impact Of Prescriptive Unlocking The Power Of Prescriptive Data Analytics SS with all 10 slides:
Use our Graph Illustrating Impact Of Prescriptive Unlocking The Power Of Prescriptive Data Analytics SS to effectively help you save your valuable time. They are readymade to fit into any presentation structure.


Most Relevant Reviews
-
Unique research projects to present in meeting.
-
I’m not a design person, so I couldn’t make a presentation to save my life. Thankfully, they have all kinds of templates that I regularly use for my work.