


Internal Forensic Audit Committee Dashboard




Try Before you Buy Download Free Sample Product
 Impress Your
 Audience
 100%
100% Editable
 Save Hours
 of Time


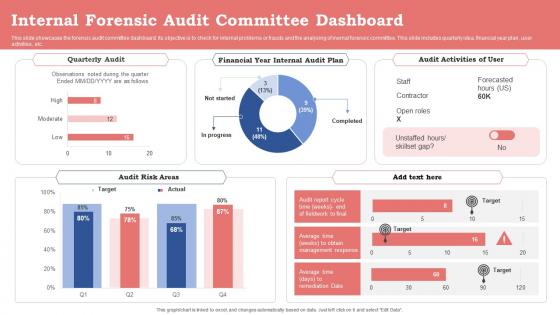
This slide showcases the forensic audit committee dashboard. Its objective is to check for internal problems or frauds and the analysing of inernal forensic committee. This slide includes quarterly idea, financial year plan, user activities, etc.
People who downloaded this PowerPoint presentation also viewed the following :
Internal Forensic Audit Committee Dashboard with all 10 slides:
Use our Internal Forensic Audit Committee Dashboard to effectively help you save your valuable time. They are readymade to fit into any presentation structure.








FAQs for Internal Forensic
Start with anomaly detection stuff - duplicate transactions, weird payment patterns, vendors acting sketchy. Case status indicators are clutch for tracking investigations, plus evidence timelines and red flag counts by department. Trend analysis is where it gets interesting though - you'll catch patterns that static reports totally miss. Financial impact is obvious but necessary: potential losses, recovery amounts, all that. Oh and make sure it updates in real-time because finding fraud weeks later is pretty much useless. I'd honestly prioritize the real-time alerts over fancy visualizations if you have to choose.
Okay so visualizations are game-changers for audit data. Like, instead of going cross-eyed staring at spreadsheets, anomalies and trends just pop right out at you. Way easier to explain your findings to people who don't want to wade through numbers too. I always catch stuff in visual transaction flows that I'd totally miss in regular tables - it's weird how your brain picks up patterns differently. Start simple though. Bar charts and heat maps work great for reports. Honestly, once you see how much clearer everything becomes, you'll wonder why you waited so long to try it.
So forensic audit dashboards are actually pretty solid at catching different types of fraud. They'll flag expense fraud, payroll schemes, vendor billing stuff, and revenue manipulation. Ghost employees get spotted fast, same with duplicate payments. What's cool is how they catch transactions that deliberately stay just under approval limits - people think they're being sneaky but the pattern gives them away. The trend analysis is probably the best part though, you can watch fraud develop over time instead of just catching random incidents. Oh, and kickbacks and asset theft too. Some of these schemes are honestly wild when you see them laid out.
Honestly, real-time integration is a game changer - it's like switching from looking at old photos to watching live video. You can actually catch fraud while it's happening instead of discovering it weeks later when the damage is already done. The cool part is getting feeds from different systems all at once - transactions, user behavior, system changes, the whole nine yards. Just don't set yourself up to get buried in alerts (learned that one the hard way). Configure triggers based on what actually matters for your specific audit. Short bursts of relevant data beat constant noise every time.
Think of risk assessment as your roadmap for the whole dashboard setup. Start by figuring out your highest-risk spots - cash flows, related party stuff, revenue recognition, you know the drill. Those areas get prime real estate on your dashboard. It's honestly like ER triage but for fraud indicators. Your risk matrix tells you which KPIs need the spotlight, what thresholds should trigger alerts, how to organize everything. Skip this step and you'll bury the important red flags under a bunch of meaningless metrics. I learned this the hard way on my first audit project. Bottom line: let your risk assessment drive the entire architecture.
Build validation checks right into your dashboard workflow - automated reconciliation, source verification, audit trails for everything. I made this mistake once and didn't catch a huge error for weeks, total nightmare. Set up alerts for weird anomalies and document your data chain religiously. Read-only sources are your friend here. Role-based access helps too. Cross-check dashboard outputs against original docs regularly - honestly, this part's boring but saves your ass later. Treat the whole dashboard like legal evidence. Start by mapping your current data flow and find where validation's weakest.
Network graphs and timelines are clutch for forensic stuff - they'll show you patterns you'd never catch otherwise. Heat maps work really well for transaction volumes too. Honestly, Sankey diagrams are probably my favorite for following money trails, even though they look intimidating at first. Box plots and scatter plots are solid for finding weird outliers in your data. Just keep everything simple since you're usually explaining this to people who hate spreadsheets. Oh, and start with whatever your biggest finding is, then build everything else around that story.
So here's the thing - management cares about fixing problems and keeping operations running smoothly. Legal teams? They're hunting through evidence trails, building their case from whatever data pops up. Regulators just want to see you're hitting compliance deadlines (honestly, they're probably the pickiest). Everyone's looking at the same info but filtering it totally differently based on their role. You'll want to set up permissions from the start so people only see what matters to them. Otherwise you'll have lawyers drowning in operational metrics they don't need.
Put the biggest red flags right at the top - auditors shouldn't have to dig for the scary stuff. Clean layout beats fancy every time. I'd stick with simple color coding (red = bad, yellow = watch out) and make those filters actually make sense. Nobody wants to click through five menus to find one piece of evidence. Build in drill-down features so they can go from the big picture to specific details fast. Oh, and definitely test it with real auditors first - they'll roast your design way better than any focus group would. Trust me on that one.
Honestly, historical data is like your cheat sheet for forensic audits. Compare sketchy transactions against normal patterns - weird stuff jumps out super fast this way. Check for changes in transaction amounts, timing, volumes, or how users typically behave. When you see spikes or random dips in the dashboard, drill down into those specific periods (that's where the good stuff usually hides). Set alerts so you'll know when current data goes way off from your baseline. The patterns are pretty obvious once you overlay everything correctly.
So there's a bunch of good options here. Tableau and Power BI are probably your best bet - most finance people already know them, and they handle big datasets without breaking a sweat. ACL Analytics is built specifically for audit stuff, so it's got fraud detection features already built in. IDEA's another solid audit tool. Hell, even Excel works for simple cases, though it gets ugly real fast when things get complicated. I'd honestly start by figuring out exactly what you need to track first, then pick whatever fits your team's skill level and how quickly you need this done.
Honestly, dashboards are game-changers for this stuff. Instead of drowning executives in spreadsheets, you're giving them visual stories they can actually follow - charts, graphs, those color-coded alerts that scream "pay attention here." Focus on what the problems mean for their business, not the technical weeds of how you discovered them. I watched one audit presentation transform from 45 painful minutes of blank stares to 15 minutes of real engagement just by going visual. Figure out what keeps your audience up at night first, then build everything around those specific worries. Way more effective than the old-school approach.
Ugh, data integration is gonna be your worst nightmare - everything's scattered across different systems and nothing talks to each other properly. Getting people to ditch their beloved Excel sheets? That's almost harder than the technical stuff, honestly. You'll be pulling your hair out trying to make dashboards detailed enough for the analysts but simple enough that C-suite actually gets it. Oh, and stakeholder buy-in is brutal too. Start with just one metric everyone can agree on first. Once they see it working, you can expand from there. Trust me on this one.
Honestly, just watch if people actually use the thing or keep going back to their old spreadsheets - that's your biggest tell right there. Check how fast they're solving cases now versus before, and whether you're catching fraud earlier in the process. False positive rates matter too since nobody wants to chase down a million dead ends. I'd start by asking your current users what's bugging them about their workflow. User satisfaction scores are pretty revealing, and don't forget to track investigation velocity. The real test? Whether teams feel like it's speeding things up or just adding another tool they have to learn.
Predictive analytics basically turns your forensic dashboards into early warning systems. You can spot weird transaction patterns or sketchy vendor behavior before things get really messy. The models flag stuff that doesn't match normal baselines - honestly, it's pretty cool watching the system catch things you might've missed. Plus it'll tell you which departments are most likely to have issues next audit cycle. Way better than just digging through what already went wrong, you know? Though I guess the tricky part is getting people to trust the predictions enough to actually investigate.
-
I am so thankful for all of the templates I've found on your site. They have saved me hours every week and helped make my presentations come alive. Keep up with these amazing product releases!
-
The templates you provide are great! They have saved me tons of time and made my presentations come alive. Thank you for this awesome product. Keep up the good work!