


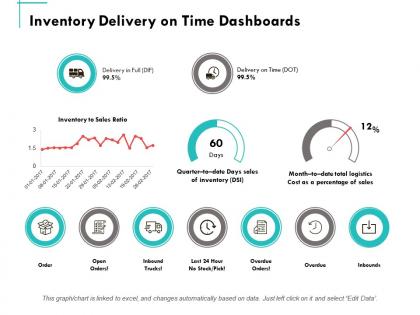
Inventory delivery on time dashboards ppt powerpoint presentation summary clipart




Try Before you Buy Download Free Sample Product
 Impress Your
 Audience
 100%
100% Editable
 Save Hours
 of Time


Be at the helm of affairs with our Inventory Delivery On Time Dashboards Ppt Powerpoint Presentation Summary Clipart.You will become the central figure.
People who downloaded this PowerPoint presentation also viewed the following :
Inventory delivery on time dashboards ppt powerpoint presentation summary clipart with all 5 slides:
Our Inventory Delivery On Time Dashboards Ppt Powerpoint Presentation Summary Clipart enhance capital growth. Keep adding on asset by asset.

FAQs for Inventory delivery on time dashboards ppt powerpoint
Essential inventory delivery KPIs include order fulfillment rate, delivery time accuracy, stockout frequency, inventory turnover ratio, and transportation costs per unit. These metrics enable organizations to streamline supply chain operations, minimize carrying costs, and enhance customer satisfaction, with many retail and manufacturing companies finding that comprehensive tracking ultimately delivers competitive advantage and operational efficiency.
Real-time data integration enhances inventory delivery tracking accuracy by providing instant visibility into shipment locations, delivery statuses, and potential delays through automated updates from GPS, warehouse systems, and carrier networks. This seamless data flow enables logistics managers to proactively address issues, optimize routes, and provide customers with precise delivery windows, ultimately reducing discrepancies and improving operational efficiency.
Effective visualization techniques for inventory delivery metrics include heat maps for regional performance, Gantt charts for delivery timelines, KPI scorecards for key indicators, trend lines for historical patterns, and interactive dashboards for real-time monitoring. These visualizations streamline decision-making by highlighting bottlenecks, optimizing route efficiency, and enhancing supply chain transparency, with many logistics companies finding that strategic visual analytics ultimately delivers faster deliveries and reduced operational costs.
Inventory delivery dashboards help identify supply chain bottlenecks by providing real-time visibility into order processing times, transportation delays, warehouse congestion, and supplier performance metrics across the entire logistics network. These dashboards enable supply chain managers to quickly pinpoint specific delays, whether in manufacturing facilities, distribution centers, or last-mile delivery, ultimately streamlining operations and enhancing customer satisfaction.
Historical data serves as the foundation for predictive analytics on inventory dashboards, enabling accurate delivery timeline forecasting through pattern recognition, seasonal trend analysis, supplier performance tracking, and demand fluctuation modeling. By analyzing past delivery performance, route efficiency, and external factors like weather impacts, retailers and manufacturers can optimize inventory planning, reduce stockouts, and enhance customer satisfaction, ultimately delivering more reliable service commitments and competitive advantage.
User experience in inventory delivery dashboards improves through intuitive navigation, real-time data visualization, customizable alerts, mobile responsiveness, and streamlined workflows that minimize clicks. These enhancements enable supply chain managers and logistics teams to quickly identify bottlenecks, track shipments, and optimize routes, ultimately delivering faster decision-making and improved operational efficiency across distribution networks.
Essential technologies include real-time data integration platforms, cloud-based analytics engines, API management systems, mobile-responsive frameworks, and automated alert mechanisms. These technologies streamline inventory tracking by connecting multiple data sources, enabling instant visibility, and delivering predictive insights, with many retail and manufacturing organizations finding that this strategic combination ultimately enhances operational efficiency and reduces costly stockouts.
Mobile compatibility enhances inventory delivery dashboards by enabling real-time tracking, instant status updates, and immediate decision-making from any location, streamlining field operations significantly. With mobile-optimized interfaces, logistics managers, warehouse supervisors, and delivery teams can access critical inventory data, update delivery statuses, and coordinate responses seamlessly, ultimately delivering faster customer service and operational efficiency.
Common challenges include data integration complexity, real-time synchronization issues, user adoption resistance, cost considerations, and ensuring accurate inventory tracking across multiple channels. While these dashboards significantly enhance operational visibility and decision-making capabilities, organizations often find that successful implementation requires strategic planning, comprehensive staff training, and robust technical infrastructure, ultimately delivering streamlined logistics and competitive advantage.
Predictive analytics can be incorporated through demand forecasting algorithms, seasonal trend analysis, supplier lead time predictions, stock-out risk assessments, and automated reorder point calculations. These capabilities enable organizations to anticipate inventory needs, optimize delivery schedules, and minimize carrying costs, with many retailers and manufacturers finding that predictive insights ultimately deliver improved service levels and reduced operational expenses.
Inventory delivery dashboards can be customized through role-based access controls, personalized KPI displays, departmental filtering options, and stakeholder-specific visualizations. While warehouse managers focus on real-time stock levels and delivery schedules, executives prioritize strategic metrics like cost efficiency and supplier performance, with many organizations finding that tailored dashboards enhance decision-making speed and operational transparency across teams.
**INPUT**: What security measures should be taken to protect data displayed on inventory delivery dashboards? **OUTPUT**: Essential security measures include multi-factor authentication, role-based access controls, data encryption, secure API connections, and regular security audits. These protocols safeguard sensitive inventory data by restricting unauthorized access, protecting data transmission, and ensuring compliance standards, with many logistics companies finding that robust security frameworks ultimately enhance customer trust while minimizing operational risks. [Word count: 54 words]
Inventory delivery dashboards facilitate communication by providing real-time visibility into stock levels, order status, and delivery schedules through centralized data sharing. These platforms streamline coordination by enabling automatic alerts for inventory shortages, delivery delays, and capacity changes, with many logistics operations finding that enhanced transparency ultimately reduces miscommunication and accelerates order fulfillment processes.
Cloud-based inventory delivery dashboards offer scalability, real-time data access, reduced IT infrastructure costs, automatic updates, and enhanced collaboration across multiple locations. These solutions streamline operations by enabling remote monitoring, facilitating instant decision-making, and delivering seamless integration with existing systems, with many logistics companies finding that cloud platforms ultimately enhance operational efficiency while significantly reducing maintenance overhead.
Businesses can measure dashboard impact through key performance indicators like inventory turnover rates, order fulfillment times, stockout frequencies, carrying costs, and delivery accuracy percentages. These metrics enable organizations to track operational improvements, with many retail and manufacturing companies finding that dashboard implementation reduces inventory costs by 15-20% while significantly enhancing supply chain visibility and decision-making speed.
No Reviews