


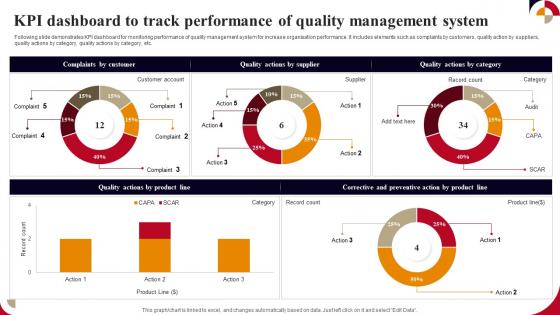
KPI Dashboard To Track Performance Of Quality Management System




Try Before you Buy Download Free Sample Product
 Impress Your
 Audience
 100%
100% Editable
 Save Hours
 of Time


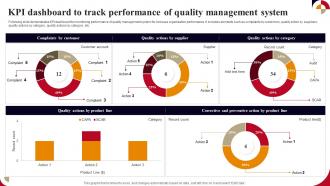
Following slide demonstrates KPI dashboard for monitoring performance of quality management system for increase organisation performance. It includes elements such as complaints by customers, quality action by suppliers, quality actions by category, quality actions by category, etc.
People who downloaded this PowerPoint presentation also viewed the following :
KPI Dashboard To Track Performance Of Quality Management System with all 7 slides:
Use our KPI Dashboard To Track Performance Of Quality Management System to effectively help you save your valuable time. They are readymade to fit into any presentation structure.





FAQs for KPI Dashboard To Track Performance Of
Essential components of an effective KPI dashboard in a Quality Management System include real-time performance metrics, defect tracking indicators, compliance status monitors, process efficiency measurements, and customer satisfaction scores. These elements work together by providing instant visibility into quality trends, enabling proactive issue resolution, and streamlining corrective actions, with many manufacturing and service organizations finding that integrated dashboards significantly reduce response times while enhancing overall operational excellence.
Organizations ensure KPI alignment with strategic quality objectives by establishing clear quality goals, mapping metrics to specific outcomes, conducting regular reviews, and involving cross-functional teams in the selection process. Through systematic alignment frameworks, companies streamline performance tracking, enhance accountability, and deliver measurable improvements in customer satisfaction, operational efficiency, and compliance standards, ultimately gaining competitive advantage in quality management.
Data visualization transforms complex KPI data into intuitive charts, graphs, heat maps, and trend lines that enable quick comprehension and decision-making. Through strategic visual design, quality management teams can instantly identify performance gaps, track improvement trajectories, and spot emerging issues, while interactive dashboards allow stakeholders to drill down into specific metrics, ultimately delivering faster response times and more informed strategic decisions across organizational levels.
KPIs in Quality Management Systems should typically be reviewed monthly for operational metrics and quarterly for strategic indicators, with annual comprehensive evaluations of relevance and alignment. This structured approach enables organizations to respond quickly to quality issues, track improvement trends, and adapt to changing regulatory requirements, with many manufacturing and healthcare organizations finding that regular review cycles enhance compliance while driving continuous operational excellence.
Common pitfalls include overloading dashboards with excessive metrics, selecting vanity metrics over actionable KPIs, poor visual design that obscures insights, lack of real-time data integration, and insufficient stakeholder input during development. These design flaws often result in dashboards that confuse rather than clarify, with many organizations finding that streamlined, user-focused approaches deliver better decision-making outcomes and higher adoption rates.
Real-time data integration enhances KPI dashboard effectiveness by providing immediate visibility into performance metrics, eliminating data lag, and enabling proactive decision-making across all operational levels. Through automated data feeds, organizations streamline reporting processes, reduce manual errors, and deliver actionable insights instantly, with many companies finding that real-time dashboards significantly improve response times and competitive positioning.
Effective KPI selection involves identifying metrics that directly align with quality objectives, customer requirements, regulatory standards, and business outcomes, while ensuring they're measurable, actionable, and timely. These practices include focusing on leading indicators like defect prevention rates, process compliance scores, and customer satisfaction metrics, with manufacturing and healthcare organizations finding that balanced scorecards combining operational efficiency with quality outcomes deliver sustained competitive advantage.
Leading organizations utilize KPI dashboards to drive continuous improvement by establishing real-time performance monitoring, identifying trend patterns across departments, and enabling data-driven decision making at all organizational levels. Through automated reporting and visual analytics, companies in manufacturing, healthcare, and financial services streamline corrective actions, accelerate response times to performance gaps, and ultimately enhance operational efficiency while maintaining competitive advantage in increasingly dynamic markets.
Recommended tools for QMS KPI dashboards include Tableau, Power BI, QlikView, Sisense, and specialized QMS platforms like MasterControl or TrackWise. These solutions streamline quality monitoring by automating data collection, providing real-time analytics, and enabling customizable reporting, with many manufacturing and healthcare organizations finding that integrated dashboards significantly enhance compliance tracking and operational efficiency.
KPI dashboards enhance stakeholder engagement by providing real-time visibility into performance metrics, automated reporting capabilities, and interactive data visualization tools that facilitate informed decision-making. Through customizable interfaces, organizations streamline communication across departments, minimize information gaps, and accelerate response times to critical issues, with many finding that transparent performance tracking ultimately delivers stronger stakeholder trust and improved operational alignment.
Compliance KPI dashboards should prioritize audit trail completeness, regulatory deadline adherence, incident response times, documentation accuracy rates, and risk assessment coverage. These metrics enable organizations to streamline regulatory reporting, minimize compliance gaps, and demonstrate due diligence, with many financial services and healthcare institutions finding that real-time compliance monitoring ultimately delivers faster audit processes and reduced regulatory penalties.
Organizations can balance quantitative and qualitative KPIs by integrating metrics like customer satisfaction scores, employee feedback ratings, and process efficiency percentages alongside traditional financial and operational data. Through strategic dashboard design, companies in healthcare, manufacturing, and financial services streamline decision-making by presenting both numerical performance indicators and experiential insights, ultimately delivering comprehensive visibility that enhances strategic planning and competitive advantage.
Strategies include automated data validation rules, regular audits and reconciliation processes, standardized data collection protocols, real-time monitoring systems, and cross-functional verification checkpoints. These approaches streamline accuracy by eliminating manual errors, detecting inconsistencies early, and establishing clear accountability, with many organizations finding that combining automated controls with human oversight delivers reliable KPI reporting and enhanced decision-making confidence.
Benchmarking against industry standards provides crucial context for selecting relevant KPIs and establishing realistic performance targets, enabling organizations to identify gaps, opportunities, and competitive positioning. Through comparative analysis, companies can prioritize metrics that drive meaningful improvement, interpret results within market context, and set achievable goals, ultimately delivering enhanced strategic decision-making and sustainable competitive advantage.
KPI dashboards facilitate a quality culture by providing real-time visibility into performance metrics, establishing accountability through measurable targets, and enabling data-driven decision making across all organizational levels. These systems streamline quality management by fostering transparency, encouraging continuous improvement initiatives, and empowering teams to proactively address issues, ultimately delivering enhanced operational excellence and competitive advantage.
-
Perfect template with attractive color combination.
-
The best and engaging collection of PPTs I’ve seen so far. Great work!