


Management Chart Samsung Company Profile CP SS




Try Before you Buy Download Free Sample Product
 Impress Your
Audience
 100%
Editable
 Save Hours
of Time


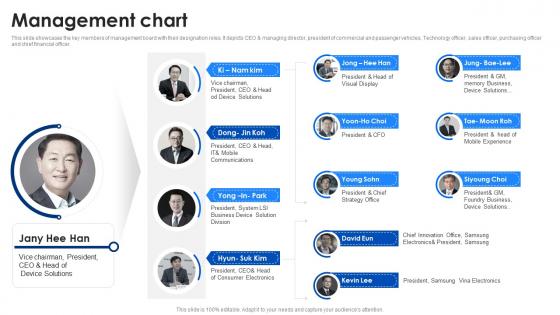
This slide showcases the key members of management board with their designation roles. It depicts CEO and managing director, president of commercial and passenger vehicles, Technology officer, sales officer, purchasing officer and chief financial officer.
People who downloaded this PowerPoint presentation also viewed the following :
Management Chart Samsung Company Profile CP SS with all 9 slides:
Use our Management Chart Samsung Company Profile CP SS to effectively help you save your valuable time. They are readymade to fit into any presentation structure.








FAQs for Management Chart Samsung Company
Honestly, start with the basics - who reports to who, what everyone's role actually is, and how to reach them. Make it visual with boxes and lines so people aren't squinting trying to figure out the hierarchy. I always throw in decision-making levels too because otherwise you get those awkward "um, can you approve this?" situations. Oh, and don't forget about those weird dotted-line relationships that exist in every company but nobody talks about. Keep it clean though - I've seen org charts that look like someone sneezed on a flowchart. Update it when people move around or you'll have folks emailing someone who left six months ago.
Honestly, these charts are lifesavers for avoiding those "wait, whose job was this?" disasters. You'll see exactly who makes what decisions and who reports to who. No more guessing games when you need approval or something goes wrong. People actually look at visual stuff too - way better than burying this info in some random document nobody reads. Communication gaps become obvious before they blow up into real problems. I'd start basic with just roles and who reports where, then maybe add decision-making stuff later once everyone's used to checking it. Trust me, the transparency alone is worth it.
Honestly, just match your chart to how people actually work together. Flat companies? Go horizontal or use those network-style diagrams that show collaboration. Traditional corporate stuff needs the classic top-down charts since reporting lines actually matter there. Matrix orgs are a nightmare (seriously, who invented those?) but dual-reporting charts help sort out the chaos. Startups should probably group by what people do, not who's the boss. Oh, and functional charts work great for agile teams. Don't pick something just because it looks professional - pick what actually makes sense for how decisions get made.
Okay so first figure out what your audience actually does with this stuff. Executives? They want quick summaries - like simple org charts or dashboard visuals they can scan fast. Middle managers need the operational details, so process flows work better. Team leads want granular info showing daily responsibilities. Honestly, I've seen gorgeous charts that just sit there unused because they don't match how people work. Quick test: will they print it, pull it up on their phone, or show it in meetings? That decision pretty much makes itself once you know that. Oh and don't overthink the fancy design part - functional beats pretty every time.
Honestly, color coding can save your ass on management charts. People need to scan stuff fast - red for overdue, yellow for at-risk, green for good. That's it. Don't get fancy with like 8 different colors because then nobody knows what anything means. I swear some people think more colors = better visual, but it just looks like a mess. Stick to 3-4 max and use the same colors across all your charts. Trust me, when you're standing in front of your boss trying to explain why the project's behind, you'll want something they can read in 2 seconds.
Dude, try Tableau or Power BI instead of those boring PowerPoint slides. Google Sheets works too if you're on a budget. The cool thing is you can add clickable filters and let people actually dig into the data themselves. Way better than static charts that just sit there looking pretty but useless. Once I started using interactive dashboards, I couldn't go back - regular charts feel so 2010 now. You can embed them on your company site or whatever. Just pick one chart first, connect it to your data, throw some filters on it. People will get it immediately.
Honestly, the biggest thing is don't overcomplicate it. Those messy charts with dotted lines everywhere? Nobody gets them. Keep reporting lines super clear. If you're showing execs, they don't need to see literally everyone - just focus on key roles. Also involve your team when you're building it! You'll avoid awkward situations where someone's like "wait, that's not what I do." Oh and for the love of god, make the text big enough to actually read. I've seen way too many org charts where you need a magnifying glass to see names.
Honestly, quarterly works for most places. Monthly if you're at a startup or somewhere that's growing like crazy - those places change so fast it's ridiculous. Set a calendar reminder every three months to review it, but don't wait if something big happens. New manager gets hired? Update it right away. Department gets restructured? Same thing. I've seen people wait months to update theirs and then nobody knows who reports to who anymore. Stable companies can probably stretch it to twice a year, but quarterly's safer.
Honestly, org charts are like having a roadmap for your company. You can spot who reports to who and figure out where decisions actually get made. Super useful when you're trying to plan strategy because you'll see exactly who needs to be in the loop. I've found they're lifesavers for those awkward moments when nobody knows whose job something is - happens more than you'd think! The best part? You can trace how your big ideas will trickle down through different teams. Everyone gets clarity on their piece of the puzzle.
Honestly, org charts are actually pretty helpful for keeping people engaged - but only if you do them right. Your team needs to know who reports to who and how decisions get made. Nothing kills morale faster than that awkward "wait, who's my actual boss?" moment. The trick is making sure it matches reality, not some fantasy version of your company structure. I've seen too many charts that look perfect on paper but mean nothing in practice. Keep yours updated and reference it when questions come up, otherwise it'll just collect dust on the wall.
Honestly, management charts are a game-changer for handling transitions. They show exactly who's doing what and when - no more confusion about roles. I've seen teams waste weeks just because nobody mapped out the process first. You can track where things stand and catch issues early. The visual element is huge too since people actually get it when they can see the whole picture laid out. Charts basically turn chaos into something manageable. Start simple: current situation, steps to get there, final goal. Way better than trying to explain everything in endless meetings.
Track both lagging stuff (revenue, customer satisfaction, defect rates) and leading indicators like pipeline health or training hours. I'd stick to maybe 5-7 metrics tops - any more and you're just drowning in data nobody looks at. Budget variance and project timelines are gold for spotting problems early. Employee productivity matters too, obviously. The real key is picking metrics that actually connect to what your team's trying to achieve and updating them regularly. Otherwise you're just making pretty charts that don't mean anything. Pick stuff you can act on, not just nice-to-know numbers.
Honestly, I'd start by figuring out what gaps your current chart has for remote stuff. You probably need roles like timezone coordinators or digital collaboration managers - people who actually keep remote teams from falling apart. Map out how decisions flow when half your team is scattered everywhere. It's weird how different communication gets when you can't just walk over to someone's desk. Don't forget the hybrid headache either. Someone needs to own in-office coordination while another person handles remote engagement. Otherwise you'll have people doing double work or nobody doing it at all. Oh, and definitely include your async communication paths. Traditional hierarchy doesn't always work the same way remotely.
Keep it simple - don't cram everything into one chart or people's eyes will glaze over. Give context first before showing all those boxes and lines. I learned this the hard way after watching too many meetings go sideways! Walk through it top-down or by department, whatever makes sense. Point out recent changes and who reports to who if it matters for what you're discussing. Oh and definitely have a digital version ready because someone always asks for it afterward. Honestly, less is more with these things.
Yeah, culture totally affects how people read charts! Red screams "danger" to Americans but means good fortune in China - wild, right? Some teams want every detail explained while others just want the bare facts. Hierarchical stuff gets interpreted differently too depending on where people are from. I'd honestly test your charts with different people first before rolling them out. Maybe skip certain color combos or add more context for cultures that need it. Actually had a colleague who learned this the hard way when his "simple" chart confused half the international team.
-
Great combination of visuals and information. Glad I purchased your subscription.
-
Wonderful ideas and visuals. I'm really pleased with the templates, which are unique and up to date.