

Milestone Infographic Bundle Powerpoint Ppt Templates And Slides





Try Before you Buy Download Free Sample Product
 Impress Your
Audience
 100%
Editable
 Save Hours
of Time


Our Milestone Infographic Bundle Powerpoint Ppt Templates And Slides are topically designed to provide an attractive backdrop to any subject. Use them to look like a presentation pro.
People who downloaded this PowerPoint presentation also viewed the following :
Milestone Infographic Bundle Powerpoint Ppt Templates And Slides with all 39 slides:
Use our Milestone Infographic Bundle Powerpoint Ppt Templates And Slides to effectively help you save your valuable time. They are readymade to fit into any presentation structure.






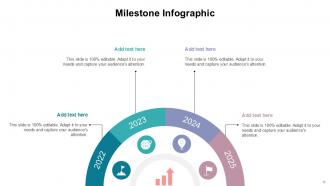

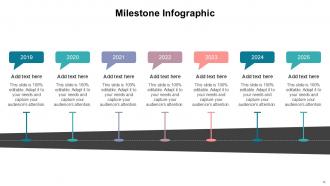


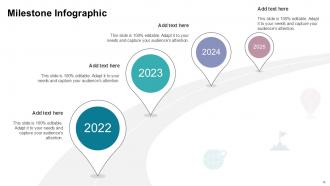

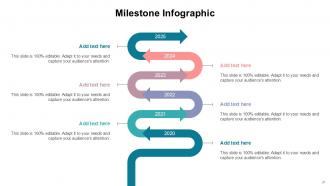











FAQs for Milestone Infographic Bundle Powerpoint Ppt
Start with a solid timeline - horizontal works great but vertical's fine too. You'll need dates, milestone titles, and short descriptions for each big moment. Icons and progress bars are your friend here - they make everything way more scannable. Colors are crucial but honestly, most people go overboard and it ends up looking like a rainbow threw up. Stick to a clean hierarchy. Add a strong header and throw in some stats if you have them. Keep descriptions super brief since people just skim these things anyway. Oh, and work backwards from your most important stuff to see what actually fits.
Colors can totally make or break your milestone infographic! Use contrasting shades to make important dates pop, then keep everything else more subdued. I'd stick to maybe 3-4 colors max - any more and it looks like a kindergarten art project. Try doing a light-to-dark progression of the same color along your timeline. That shows movement really well. Start with your brand colors as the base, but throw in one bright accent for the biggest milestones. Oh, and test it in black and white first! If you can't tell what's important when it's grayscale, your contrast needs work.
Honestly, these work great for anything that happens in steps over time - product launches, construction projects, software dev, marketing campaigns. Event planning is perfect too since there's always a million things happening before the main event. Non-technical people especially love them because let's be real, nobody wants to read through dense project reports. I'd start by picking your 5-7 biggest milestones first. Then you can build everything else around those key points. Way easier than trying to cram every little detail into one visual.
Dude, storytelling makes ALL the difference. Without it, your infographic is just boring dots on a timeline. You need to show the actual journey - like what struggles happened between point A and B, you know? Think of it as telling someone about a crazy comeback story, but with data backing it up. Each milestone should connect to the next one and actually go somewhere meaningful. Find your main theme first (maybe it's growth, a major pivot, whatever), then arrange everything to support that narrative. People remember stories way better than random facts anyway.
Honestly, just start with Canva - their timeline templates are solid and you don't need to be a designer. If you're working with a team, Figma's collaborative features are clutch. Adobe Illustrator gives you total control but it's way too much unless this is your job. Venngage does good infographic-specific stuff too. I mean, you could even use PowerPoint in a pinch, though that feels kinda janky. Try Canva's free version first and upgrade later if you need more features. No point dropping money on fancy tools until you know what you actually need.
Honestly, those milestone infographics are so much better than scrolling through endless spreadsheets. You can actually see what's done and what's coming up without getting lost in the weeds. Clients eat this stuff up too - way better than handing them some boring 20-page report they'll never read. Your team will know exactly where things stand and catch problems before they blow up. I'd probably update it weekly if you can manage it. Makes those team meetings way more productive when everyone can see the big picture at once.
Honestly, just swap the visuals and you're halfway there. Tech stuff works with rockets and circuit boards - stick with blues and greens. Healthcare? Medical icons with softer colors. Manufacturing needs gears and those industrial orange/gray vibes. The wording matters too though. "Product launch" becomes "drug approval" for pharma, "facility opening" for retail chains. I'd focus on maybe 3-4 visual elements that instantly say "this is my industry" and go from there. Icons make way more difference than you'd think - it's weird how much they change the whole feel. Keep your timeline structure but make everything sound like it belongs in your world.
Don't cram everything in there - seriously, less is more. People bail if it's too cluttered. Also watch your font size (nobody's squinting to read tiny text) and keep your spacing consistent between events. Colors should actually mean something, not just look pretty. Short descriptions work way better than paragraphs. Make sure it flows logically - left to right or top to bottom, whatever feels natural. Honestly, the visual hierarchy thing matters more than you'd think. Test it on a friend first. If they look confused or start squinting, you've got some editing to do.
So visual hierarchy is just guiding where people look first, second, etc. You want your biggest milestones to literally jump off the page - bigger fonts, bolder colors, whatever works. Then scale everything else down from there. I learned this the hard way when my first infographic looked like someone threw text at a wall! Short sentences work great too. Mix in some muted colors for the less important stuff so it doesn't compete. Honestly, pick your top 2-3 achievements and let those be the stars. Everything else can chill in the background.
Honestly, milestone infographics work in pretty much every field. Apple's iPhone timeline is a classic example - tech companies are obsessed with showing their product evolution. Healthcare uses them for patient journeys, which actually makes sense since medical stuff can be confusing. Construction projects look way less boring when you map out the phases visually. Schools do student progress charts all the time. My advice? Check out what your competitors are doing first. Find a template that doesn't look too cluttered for your data, then just steal their best ideas and make it your own. Works every time.
Honestly? Keep it super simple – max 3-5 milestones or people just zone out. I'd go with basic icons and bullet points instead of cramming paragraphs everywhere. Make it flow left to right or top to bottom, whatever feels natural. Use consistent colors so it doesn't look like a rainbow exploded on your screen. The real test though? Show it to someone who knows nothing about your topic. If they squint or look confused, you've probably overdone it. I swear, the best timelines are the ones that feel almost too simple at first.
Okay so typography is honestly make-or-break for timeline stuff. Use bold headers for the big milestones, then smaller text for all the details. Keep your font weights consistent though - maybe 2 or 3 max. Don't get tempted by weird decorative fonts (yeah, Comic Sans is still banned lol). The text should flow with your design, not fight against it. Oh and definitely test how it looks at different sizes first! I learned that one the hard way. Quick scanning is what you're going for - people won't read every word if the hierarchy is messy.
Honestly, milestone infographics are a game-changer for stakeholder meetings. They show progress and what's coming up way better than boring spreadsheets or bullet points. Stakeholders eat this stuff up - they want to see where their money's going, right? Perfect for getting everyone on the same page about timelines or showing off what you've already knocked out. I usually toss one in the appendix for later reference too. Oh, and match the colors to your project theme. Makes it look way more professional than the default templates everyone uses.
Honestly, less is more with these things. Make it like 70% visuals, 30% text - people just scan anyway, so don't write a whole essay for each point. Icons work way better than long descriptions. I learned this the hard way, but test it on someone first. Show them for 10 seconds and see if they get it. If not, you've crammed too much in there. Keep your colors and spacing consistent so it actually flows. One message per milestone section. Group similar stuff together and don't be afraid of white space - it makes everything look cleaner and easier to follow.
For your milestone infographic, start with progress bars - they're perfect for showing completion percentages. Timeline charts work really well too, especially with visual markers at each stage. Simple bar graphs can display your revenue growth or user adoption numbers. Honestly, I'm a sucker for good color coding and icons... sometimes the basic stuff just hits different. Pie charts are solid for budget breakdowns across milestones. Don't pick fancy visuals just because they look cool though. Figure out your most important data point first, then build everything else around that story.
-
The templates are easy to get, and the chat customer support is excellent.
-
I was never satisfied with my own presentation design but SlideTeam has solved that problem for me. Thank you SlideTeam!