


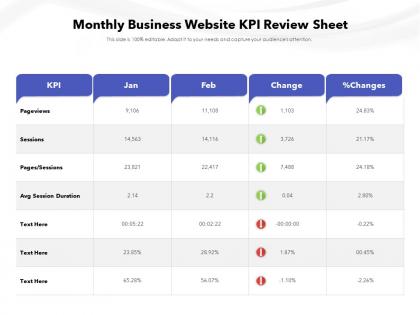
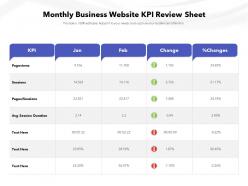
Monthly business website kpi review sheet




Try Before you Buy Download Free Sample Product
 Impress Your
 Audience
 100%
100% Editable
 Save Hours
 of Time


Our Monthly Business Website KPI Review Sheet are topically designed to provide an attractive backdrop to any subject. Use them to look like a presentation pro.
People who downloaded this PowerPoint presentation also viewed the following :
Monthly business website kpi review sheet with all 2 slides:
Use our Monthly Business Website KPI Review Sheet to effectively help you save your valuable time. They are readymade to fit into any presentation structure.
FAQs for Monthly business website
Critical KPIs for measuring business success include revenue growth, profit margins, customer acquisition cost, customer lifetime value, and operational efficiency metrics. These indicators enable organizations to track financial performance, customer relationships, and internal processes simultaneously, with many companies finding that monitoring this strategic combination delivers enhanced decision-making capabilities and sustainable competitive advantage.
Determining industry-relevant KPIs requires analyzing your sector's competitive landscape, regulatory requirements, customer expectations, and operational challenges. Financial services prioritize risk metrics and compliance ratios, while manufacturing focuses on efficiency and quality indicators, with many organizations finding that combining industry benchmarks with company-specific strategic objectives delivers the most actionable performance insights.
Leading indicators predict future performance through metrics like employee training hours, customer acquisition rates, and process improvement initiatives, while lagging indicators measure outcomes like revenue, customer satisfaction scores, and market share. Strategic KPI selection combines both types, with leading indicators enabling proactive management and course correction, and lagging indicators validating results, ultimately delivering comprehensive performance visibility and competitive advantage.
KPIs drive employee performance by establishing clear expectations, providing measurable targets, and creating transparent accountability frameworks that align individual contributions with organizational objectives. Through regular performance reviews, goal-setting sessions, and real-time dashboards, organizations enable employees to track progress, identify improvement areas, and celebrate achievements, ultimately fostering a culture of continuous improvement and results-driven accountability.
Effective KPI tracking tools include business intelligence platforms like Tableau and Power BI, analytics software such as Google Analytics, specialized dashboards like Klipfolio, and integrated CRM systems. These technologies streamline data visualization, automate reporting processes, and enable real-time monitoring across departments, with many organizations finding that comprehensive dashboards ultimately enhance decision-making speed and strategic alignment.
KPIs should be reviewed monthly for operational metrics and quarterly for strategic indicators, with annual comprehensive evaluations to ensure alignment with evolving business objectives. While high-frequency metrics like sales performance require weekly monitoring, strategic KPIs benefit from deeper quarterly analysis, with many organizations finding that regular reviews enhance decision-making accuracy and competitive responsiveness.
Strategies include cascading objectives from corporate to departmental levels, involving stakeholders in KPI selection, establishing clear accountability frameworks, and implementing regular review cycles to ensure continued relevance. These approaches streamline performance management by creating transparent connections between individual contributions and strategic goals, with many organizations finding that aligned KPIs enhance decision-making and ultimately deliver improved operational efficiency and competitive advantage.
Organizations ensure effective KPI communication through regular dashboard updates, visual performance displays, standardized reporting formats, cross-departmental meetings, and clear accountability frameworks. These approaches streamline information flow by establishing consistent metrics language, automated tracking systems, and transparent progress sharing, with many companies finding that integrated communication platforms ultimately deliver improved alignment and faster strategic decision-making.
Common KPI pitfalls include selecting too many metrics, choosing vanity metrics over actionable ones, lacking clear ownership, setting unrealistic targets, and failing to align with strategic objectives. Organizations often find that focusing on 3-5 meaningful KPIs, ensuring regular review cycles, and connecting metrics directly to business outcomes delivers better performance tracking and more effective decision-making across teams.
KPIs vary significantly across departments, with marketing focusing on lead generation, conversion rates, customer acquisition costs, and brand engagement metrics, while finance prioritizes revenue growth, profit margins, cash flow, and return on investment. These departmental differences reflect each area's unique objectives and success measures, with marketing teams tracking customer journey effectiveness and finance teams monitoring organizational financial health, ultimately enabling comprehensive business performance assessment.
Culture significantly impacts KPI implementation by influencing employee engagement, data transparency, accountability levels, and change resistance throughout organizations. Companies with collaborative cultures often see enhanced KPI adoption and performance measurement accuracy, while hierarchical environments may face communication barriers, ultimately affecting strategic alignment and competitive advantage in increasingly data-driven business landscapes.
Visualizations enhance KPI understanding by transforming complex data into clear charts, graphs, dashboards, and infographics that highlight trends, patterns, and performance gaps instantly. Through strategic visual design, presenters streamline decision-making processes, enable faster identification of actionable insights, and facilitate more engaging stakeholder discussions, ultimately delivering improved communication effectiveness and accelerated business responses.
Quantitative KPIs measure numerical data like revenue, conversion rates, production volumes, and customer acquisition costs, while qualitative KPIs assess subjective factors such as customer satisfaction, brand perception, employee engagement, and service quality. These complementary metrics work together to provide comprehensive business insights, with many organizations finding that combining both approaches delivers deeper understanding of performance trends and enables more strategic decision-making.
KPI integration into balanced scorecard frameworks involves aligning metrics across financial, customer, internal process, and learning perspectives through strategic mapping, cascading objectives from organizational to departmental levels, and establishing cause-and-effect relationships between measures. This strategic combination enables organizations to monitor comprehensive performance beyond financial metrics, with many companies finding that balanced scorecards deliver enhanced strategic focus and improved decision-making capabilities.
Customer satisfaction KPIs include Net Promoter Score (NPS), Customer Satisfaction Score (CSAT), Customer Effort Score (CES), retention rates, and complaint resolution times. These metrics enable organizations to streamline service delivery, enhance customer experiences, and identify improvement opportunities, with many retail and financial services companies finding that strategic KPI monitoring ultimately delivers competitive advantage and increased loyalty.
No Reviews