


Monthly corporate assessment powerpoint presentation slides


Try Before you Buy Download Free Sample Product
 Impress Your
 Audience
Editable
of Time


Highlight the ways to monitor the performance of business-related activities by using our engaging Monthly Corporate Assessment PowerPoint Presentation Slides. With the help of this content ready corporate analysis PPT theme, you can show how to maintain the monthly revenue report of your organization. You can define the core competencies and accomplished projects of your company with the aid of the business performance assessment presentation slides. Use the business performance analysis process PowerPoint graphic and elaborate on the overall financial summary of your organization. Take the assistance of this professionally designed monthly performance review PPT visual and describe how to assess the performance of the business activities or tasks. Employ the monthly organizational assessment PowerPoint layout and display the key developments and milestones that you have achieved in a month. Therefore, download our ready-to-use financial planning & analysis PPT deck to showcase the total assets and liabilities of your organization.
People who downloaded this PowerPoint presentation also viewed the following :
Content of this Powerpoint Presentation
Slide 1: This slide introduces Monthly Corporate Assessment. State Your Company Name and begin.
Slide 2: This is an Agenda slide. State your agendas here.
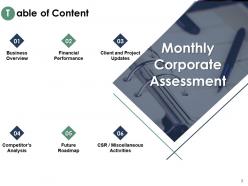
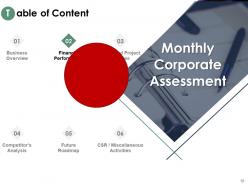
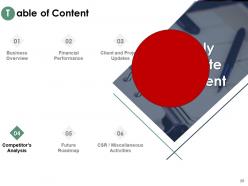
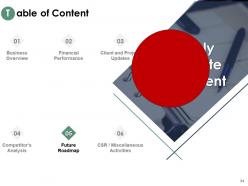
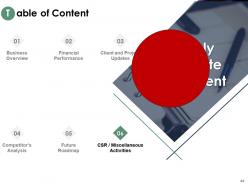
Slide 3: This slide shows Table of Content for the presentation.
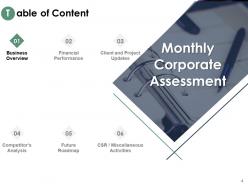
Slide 4: This slide highlights Business Overview from Table of Content.
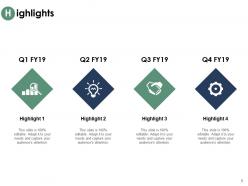
Slide 5: This slide displays Highlights with related icons and additional text boxes.
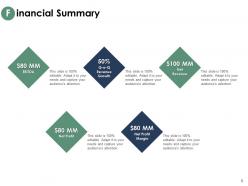
Slide 6: This slide presents Financial Summary describing- EBITDA, Net Profit, Q-O-Q Revenue Growth, Net Profit Margin, Net Revenue.
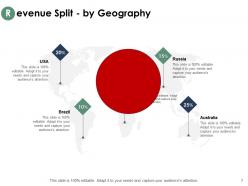
Slide 7: This slide showcases Revenue Split - by Geography showing data in percentage.
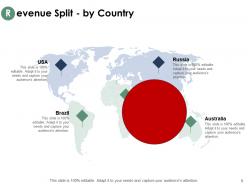
Slide 8: This slide represents Revenue Split - by Country including countries as- Asia, Australia, South America, North America, Africa.
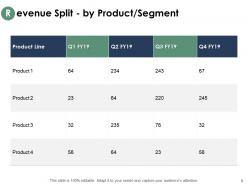
Slide 9: This slide shows Revenue Split - by Product/ Segment in tabular form.
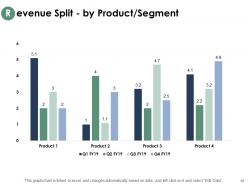
Slide 10: This slide presents Revenue Split - by Product/ Segment in graphical form.
Slide 11: This slide displays Key Developments/ Milestones Achieved with related imagery.
Slide 12: This slide highlights Financial Performance from Table of Content.
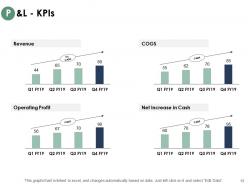
Slide 13: This slide represents P&L - KPIs describing- Revenue, COGS, Operating Profit, Net Increase in Cash.
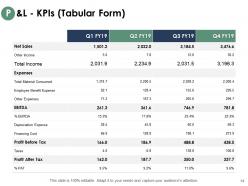
Slide 14: This slide shows P&L - KPIs in Tabular Form.
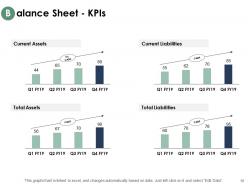
Slide 15: This slide presents Balance Sheet - KPIs in graphical form.
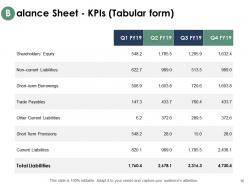
Slide 16: This slide presents Balance Sheet - KPIs (Tabular Form) showing liabilities.
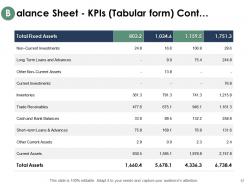
Slide 17: This slide displays Balance Sheet - KPIs (Tabular Form) showing assests.
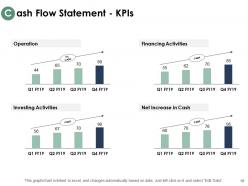
Slide 18: This slide represents Cash Flow Statement - KPIs describing- Operation, Financing Activities, Investing Activities, Net Increase In Cash.
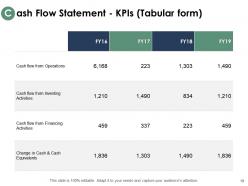
Slide 19: This slide showcases Cash Flow Statement - KPIs (Tabular Form).
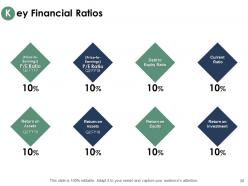
Slide 20: This slide shows Key Financial Ratios including- P/E Ratio, Debt to Equity Ratio, Current ratio, Return on Assets, Return on Equity, Return on Investment.
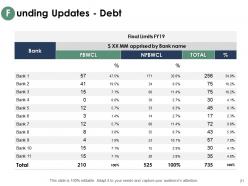
Slide 21: This slide presents Funding Updates showing Debts.
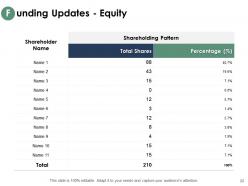
Slide 22: This slide presents Funding Updates showing Equity.
Slide 23: This slide highlights Client and Project Updates from Table of Content.
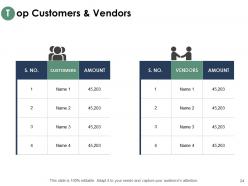
Slide 24: This slide displays Top Customers & Vendors in tabular form.
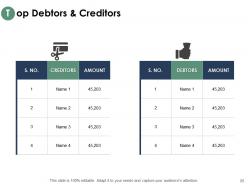
Slide 25: This slide represents Top Debtors & Creditors.
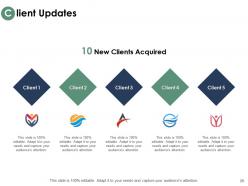
Slide 26: This slide showcases Client Updates with related images.
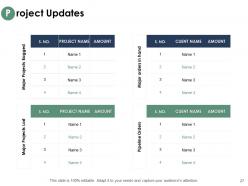
Slide 27: This slide shows Project Updates on major projects bagged, major orders in hand, major projects lost and pipeline orders.
Slide 28: This slide highlights Competitor's Analysis from Table of Content.
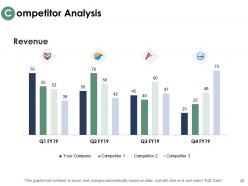
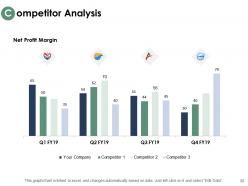
Slide 29: This slide shows Competitor Analysis with the help of bar graph.
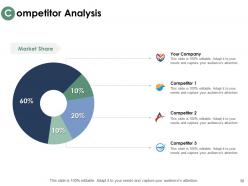
Slide 30: This slide presents Competitor Analysis with the help of Pie Chart.
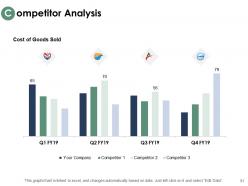
Slide 31: This is an optional slide on Competitor Analysis.
Slide 32: This is another optional slide on Competitor Analysis.
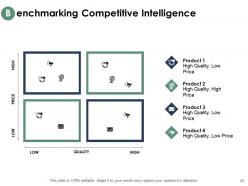
Slide 33: This slide showcases Benchmarking Competitive Intelligence in matrix form.
Slide 34: This slide highlights Future Roadmap from Table of Content.
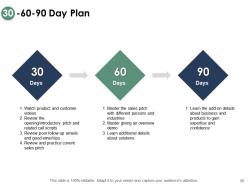
Slide 35: This slide shows 30-60-90 Day Plan with text boxes.
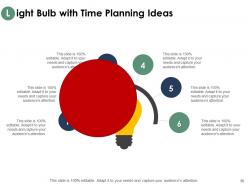
Slide 36: This slide presents Light Bulb with Time Planning Ideas.
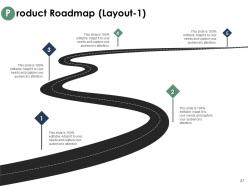
Slide 37: This slide displays Product Roadmap (Layout - 1) in timeline form.
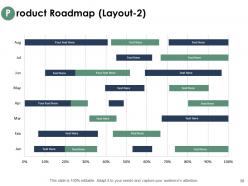
Slide 38: This slide represents Product Roadmap (Layout - 2) in graphical form.
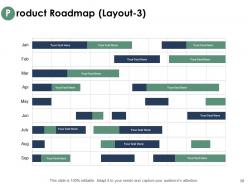
Slide 39: This slide showcases Product Roadmap (Layout - 3).
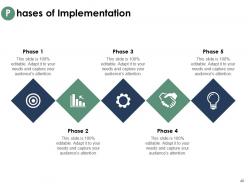
Slide 40: This slide shows Phases of Implementation with text boxes.
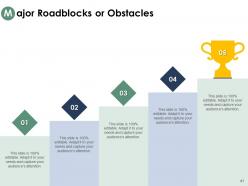
Slide 41: This slide presents Major Roadblocks or Obstacles.
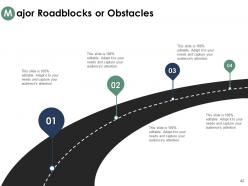
Slide 42: This is an optional slide for Major Roadblocks or Obstacles.
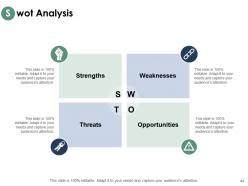
Slide 43: This slide displays Swot Analysis. Describe your firm's Strengths, weaknesses, opportunities and threats.
Slide 44: This slide highlights CSR / Miscellaneous Activities from Table of Content.
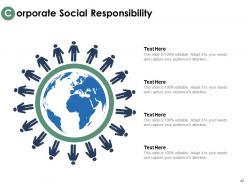
Slide 45: This slide represents Corporate Social Responsibility (CSR) with related diagram and text boxes.
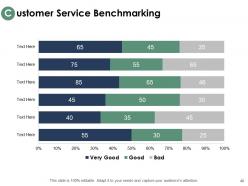
Slide 46: This slide showcases Customer Service Benchmarking in graphical form.
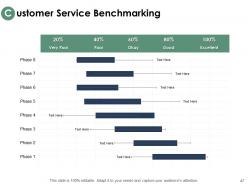
Slide 47: This is an optional slide for Customer Service Benchmarking.
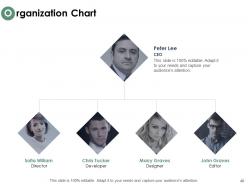
Slide 48: This slide shows Organization Chart with names and designation.
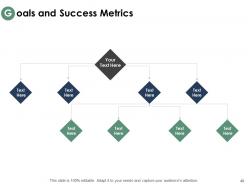
Slide 49: This slide presents Goals and Success Metrics. Add data as per needs.
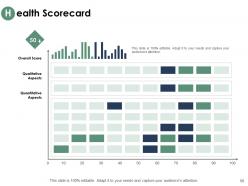
Slide 50: This slide displays Health Scorecard with Overall Score, Qualitative Aspects, Quantitative Aspects.
Slide 51: This slide showcases Monthly Corporate Assessment Icons.
Slide 52: This slide reminds about 15 minutes coffee break.
Slide 53: This slide is titled as Additional Slides for moving forward.
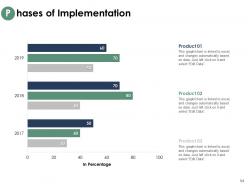
Slide 54: This slide shows Phases of Implementation in the form of bar graph.
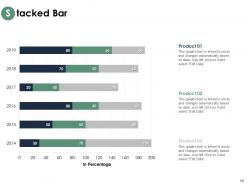
Slide 55: This slide displays Stacked Bar chart with three products comparison.
Slide 56: This is Our Mission slide with related imagery and text.
Slide 57: This is Meet Our Team slide with names and designation.
Slide 58: This is a Venn slide with text boxes.
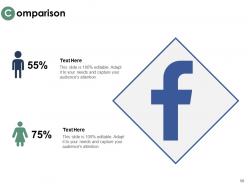
Slide 59: This is a Comparison slide to state comparison between commodities, entities etc.
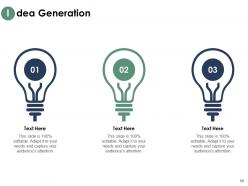
Slide 60: This is an Idea Generation slide to state a new idea or highlight information, specifications etc.
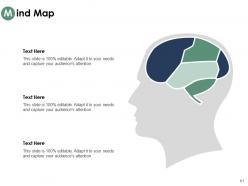
Slide 61: This slide shows Mind Map for representing entities.
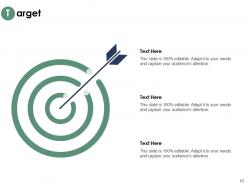
Slide 62: This is a Target slide. State your targets here.
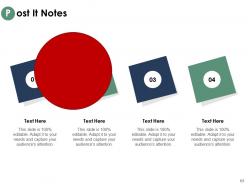
Slide 63: This slide is titled as Post it Notes. Post your important notes here.
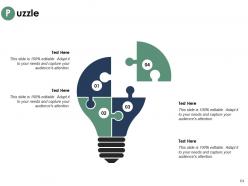
Slide 64: This is a Puzzle slide with text boxes to show information.
Slide 65: This is a Thank You slide with address, contact numbers and email address.
Monthly corporate assessment powerpoint presentation slides with all 65 slides:
Use our Monthly Corporate Assessment Powerpoint Presentation Slides to effectively help you save your valuable time. They are readymade to fit into any presentation structure.


-
Excellent design and quick turnaround.
-
Top Quality presentations that are easily editable.
-
Content of slide is easy to understand and edit.
-
Easily Understandable slides.
-
Thanks for all your great templates they have saved me lots of time and accelerate my presentations. Great product, keep them up!