


Network Performance Monitoring And Tracking Dashboard Network Architecture





Try Before you Buy Download Free Sample Product
 Impress Your
 Audience
 100%
100% Editable
 Save Hours
 of Time


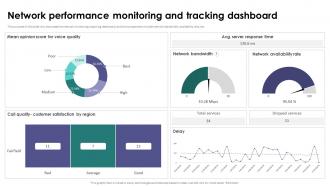
The purpose of this slide is to showcase the network monitoring reporting dashboard, and the components include network bandwidth, availability rate, etc.
People who downloaded this PowerPoint presentation also viewed the following :
Network Performance Monitoring And Tracking Dashboard Network Architecture with all 10 slides:
Use our Network Performance Monitoring And Tracking Dashboard Network Architecture to effectively help you save your valuable time. They are readymade to fit into any presentation structure.









FAQs for Network Performance Monitoring And Tracking
Network performance monitoring dashboards should include bandwidth utilization, latency and response times, packet loss rates, network availability and uptime, device health status, and traffic flow patterns. These metrics enable IT teams to proactively identify bottlenecks, optimize resource allocation, and maintain service quality, with many organizations finding that comprehensive visibility ultimately delivers faster troubleshooting and enhanced user experiences.
Real-time data visualization enhances network performance troubleshooting by providing instant visibility into traffic patterns, bottlenecks, and anomalies through interactive charts, heat maps, and flow diagrams. These visual tools enable IT teams to quickly identify root causes, correlate issues across network segments, and implement targeted fixes, ultimately reducing downtime and improving operational efficiency.
Best practices for organizing network performance data include categorizing metrics by network layers, implementing hierarchical dashboards with drill-down capabilities, using color-coded alerts for threshold breaches, and establishing standardized time intervals for data collection. These approaches streamline analysis by enabling network administrators to quickly identify bottlenecks, track performance trends, and prioritize critical issues, ultimately delivering faster troubleshooting and enhanced network reliability.
Latency directly impacts user experience by causing delays in application responses, slower page loads, and reduced productivity, with studies showing users abandon sessions after 3-second delays. Effective monitoring involves real-time network analysis tools, synthetic transaction testing, and end-user experience monitoring, enabling IT teams to identify bottlenecks proactively and optimize performance before customer satisfaction declines.
Uptime serves as a critical network performance indicator, measuring system availability and directly impacting business operations, customer satisfaction, and revenue generation. Effective dashboard displays should feature real-time uptime percentages, historical trend graphs, and color-coded alerts, with many organizations finding that prominent uptime visualization enables faster incident response, minimizes downtime costs, and ultimately delivers improved service reliability and competitive advantage.
Predictive analytics enhances proactive network management by analyzing historical patterns, identifying potential bottlenecks, and forecasting capacity needs before issues occur. Through machine learning algorithms, organizations streamline maintenance scheduling, minimize unexpected downtime, and optimize resource allocation, with many enterprises finding that predictive insights deliver significantly faster incident resolution and improved operational efficiency.
Common pitfalls include information overload with excessive metrics, poor visual hierarchy making critical alerts hard to spot, lack of customization for different user roles, inadequate real-time data refresh rates, and missing contextual information. These design flaws often overwhelm network administrators, delay incident response times, and reduce operational efficiency, with many organizations finding that simplified, role-based dashboards significantly enhance troubleshooting speed and decision-making accuracy.
Threshold alerts enhance network performance monitoring strategies by establishing proactive baselines for bandwidth utilization, latency metrics, and system availability, automatically triggering notifications when parameters exceed predetermined limits. Through intelligent alert configuration, IT teams minimize downtime, accelerate incident response, and maintain optimal network performance, with many organizations finding that strategic threshold management reduces false positives while ensuring critical issues receive immediate attention.
**INPUT**: What types of data sources should be considered when building a comprehensive performance dashboard? **OUTPUT**: Comprehensive performance dashboards should integrate network infrastructure metrics, application performance data, user experience analytics, security event logs, and business transaction records. These diverse data sources enable organizations to correlate technical performance with business outcomes, with many enterprises finding that combining real-time monitoring with historical trends delivers enhanced operational visibility and faster issue resolution. *[Word count: 54 words]*
Historical performance data enables network planning by identifying traffic patterns, capacity bottlenecks, peak usage periods, and infrastructure limitations over time. Through trend analysis and predictive modeling, organizations can strategically allocate resources, optimize bandwidth distribution, and proactively upgrade network components, with many enterprises finding that data-driven planning reduces costs while enhancing performance scalability.
User feedback drives dashboard enhancements through identifying usability gaps, requesting customizable visualization options, highlighting missing performance metrics, and suggesting automated alert improvements. Organizations leverage this input to streamline interface design, enhance real-time monitoring capabilities, and integrate predictive analytics features, ultimately delivering more intuitive operational experiences and faster network issue resolution.
Essential tools include network monitoring software like SolarWinds or PRTG, data visualization platforms such as Grafana or Tableau, SNMP protocols for device communication, real-time analytics engines, and API integrations for comprehensive data collection. These technologies streamline network oversight by consolidating performance metrics, automating alert systems, and delivering intuitive visual interfaces, with many IT departments finding that strategic dashboard implementation ultimately enhances operational efficiency and reduces troubleshooting time.
Automated reporting features streamline IT workflows by generating real-time alerts, scheduling regular performance summaries, and creating customized dashboards for different stakeholders. These capabilities enable IT teams to proactively identify network bottlenecks, reduce manual monitoring tasks, and allocate resources more strategically, ultimately delivering faster incident response and improved operational efficiency across the organization.
Security considerations for network performance dashboards include role-based access controls, data encryption, audit logging, network segmentation, and secure authentication protocols. These measures protect sensitive infrastructure data by restricting unauthorized access, encrypting data transmission and storage, and maintaining comprehensive activity trails, while organizations increasingly find that implementing multi-layered security frameworks ultimately delivers both operational visibility and regulatory compliance.
Machine learning revolutionizes network performance monitoring by enabling predictive analytics, automated anomaly detection, intelligent root cause analysis, and dynamic threshold adjustments. Through AI-driven pattern recognition, organizations can anticipate network failures before they occur, automatically resolve routine issues, and optimize bandwidth allocation, ultimately delivering faster incident response and significantly reduced downtime costs.
-
Professional and unique presentations.
-
One word for SlideTeam–Versatile!