

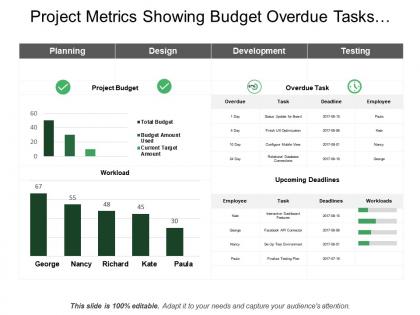
Project metrics showing budget overdue tasks workload




Try Before you Buy Download Free Sample Product
 Impress Your
 Audience
 100%
100% Editable
 Save Hours
 of Time


Explore the catalog of our Project Metrics Showing Budget Overdue Tasks Workload. Discover images that fit your ideas like a glove.
People who downloaded this PowerPoint presentation also viewed the following :
Project metrics showing budget overdue tasks workload with all 6 slides:
Convey your ideas in an artistic fashion with our Project Metrics Showing Budget Overdue Tasks Workload. Indulge in a bit of drama.



FAQs for Project metrics showing budget
Essential project metrics include schedule variance, budget variance, scope creep, resource utilization, quality indicators, and stakeholder satisfaction scores. These metrics enable project managers to identify potential issues early, optimize resource allocation, and maintain project alignment, with many organizations finding that consistent tracking ultimately delivers improved on-time delivery rates and enhanced client relationships.
Project metrics influence decision-making by providing data-driven insights into performance, budget variance, timeline adherence, and resource utilization across teams and departments. Through comprehensive analytics, organizations streamline resource allocation, identify bottlenecks early, and optimize project portfolios, with many companies finding that strategic metrics ultimately deliver faster project completion and improved ROI.
Qualitative metrics provide insights into stakeholder satisfaction, team morale, and project quality, while quantitative metrics deliver measurable data on timelines, budgets, and performance benchmarks. Through strategic combination of both approaches, organizations enhance project evaluation accuracy, streamline decision-making processes, and ultimately achieve better resource allocation, with many finding that balanced metrics frameworks deliver comprehensive project insights and competitive advantage.
Establishing project baselines involves defining clear success criteria, documenting current performance levels, setting measurable KPIs, and aligning stakeholder expectations before project initiation. These benchmarks enable organizations to track progress through cost variance, schedule adherence, and quality metrics, with many project managers finding that comprehensive baselines ultimately deliver better resource allocation and stakeholder satisfaction.
**INPUT**: What tools and software are available to help track and analyze project metrics? **OUTPUT**: Project metrics tracking tools include Microsoft Project, Asana, Jira, Trello, Smartsheet, and Tableau for comprehensive monitoring and analysis. These platforms streamline performance measurement by automating data collection, generating real-time dashboards, and enabling predictive analytics, with many organizations finding that integrated solutions ultimately deliver enhanced project visibility and faster decision-making capabilities. **Word count**: 54 words
Project metrics vary significantly across industries, with IT focusing on sprint velocity, code quality, and system uptime, construction emphasizing safety incidents, schedule adherence, and cost per square foot, while healthcare prioritizes patient outcomes, compliance rates, and resource utilization. These industry-specific measurements enable organizations to optimize operational efficiency, ensure regulatory compliance, and deliver superior results, with many finding that tailored metrics ultimately drive competitive advantage in their respective sectors.
Leading indicators predict future project performance through metrics like task completion rates, resource utilization, and milestone adherence, while lagging indicators measure outcomes after they occur, such as final budget variance, schedule delays, and quality defects. This strategic combination enables project managers to make proactive adjustments and course corrections, with many organizations finding that balanced dashboards ultimately deliver better project outcomes and stakeholder satisfaction.
Project metrics enhance team performance by identifying bottlenecks, tracking progress against benchmarks, and highlighting areas for skill development and resource reallocation. Through data-driven insights, teams can streamline workflows, reduce project delays, and optimize task distribution, with many organizations finding that consistent metrics tracking ultimately delivers improved productivity and stronger project outcomes.
Project managers encounter challenges including inconsistent data collection methods, selecting relevant metrics from numerous options, managing real-time data accuracy, and avoiding analysis paralysis from information overload. These obstacles often stem from inadequate tracking systems, stakeholder misalignment on success criteria, and balancing quantitative measurements with qualitative insights, ultimately requiring strategic frameworks that streamline metric interpretation while delivering actionable project intelligence.
**INPUT**: How can we ensure that project metrics align with organizational goals and objectives? **OUTPUT**: Ensuring project metrics align with organizational goals requires establishing clear strategic connections through cascading KPIs, regular stakeholder consultations, and outcome-focused measurement frameworks. Organizations achieve this alignment by mapping project deliverables to business objectives, conducting quarterly metric reviews with leadership teams, and adjusting tracking mechanisms based on evolving priorities, ultimately delivering measurable value and strategic competitive advantage. **Word count: 60 words**
Stakeholder feedback can be integrated through regular satisfaction surveys, milestone reviews, communication effectiveness scores, expectation alignment tracking, and feedback response time measurements. These metrics enable project managers to monitor stakeholder engagement levels, identify potential issues early, and adjust project approaches accordingly, ultimately delivering better outcomes while maintaining strong stakeholder relationships throughout the project lifecycle.
Project metrics should be reviewed weekly during active phases and bi-weekly during stable periods, with formal adjustments quarterly or when significant scope changes occur. This cadence enables project managers to identify performance trends, resource bottlenecks, and timeline deviations early, while many organizations find that regular metric reviews ultimately deliver improved project outcomes and stakeholder confidence.
Common pitfalls include selecting too many metrics, focusing on vanity metrics over actionable ones, ignoring stakeholder alignment, and failing to establish baseline measurements. These measurement challenges can derail project success by creating confusion, misallocating resources, and missing critical performance indicators, with many organizations finding that strategic metric selection ultimately delivers clearer decision-making and improved outcomes.
Predictive analytics enhances project metrics by forecasting potential risks, identifying resource bottlenecks, and predicting timeline deviations before they occur. Through machine learning algorithms and historical data analysis, project managers can proactively adjust schedules, reallocate resources, and mitigate risks, ultimately delivering more successful outcomes and improved stakeholder satisfaction.
Best practices for reporting project metrics include establishing clear reporting schedules, using visual dashboards with key performance indicators, tailoring reports to different stakeholder needs, and maintaining consistent data formats. These approaches streamline communication by providing real-time visibility, reducing information overload, and enabling data-driven decision making, with many organizations finding that standardized reporting ultimately enhances project transparency and stakeholder engagement.
-
Use of icon with content is very relateable, informative and appealing.
-
Good research work and creative work done on every template.