


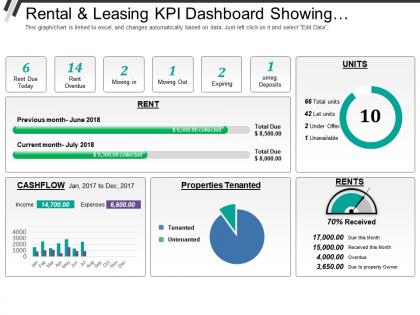
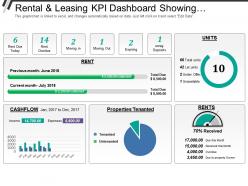
Rental and leasing kpi dashboard showing rent due today rent overdue properties tenanted




Try Before you Buy Download Free Sample Product
 Impress Your
 Audience
 100%
100% Editable
 Save Hours
 of Time


Enhance civic consciousness with our Rental And Leasing Kpi Dashboard Showing Rent Due Today Rent Overdue Properties Tenanted. Encourage folks to be good citizens.
People who downloaded this PowerPoint presentation also viewed the following :
Rental and leasing kpi dashboard showing rent due today rent overdue properties tenanted with all 6 slides:
Clear and concise is the credo of our Rental And Leasing Kpi Dashboard Showing Rent Due Today Rent Overdue Properties Tenanted. Use them and dispel any doubts your team may have.




FAQs for Rental and leasing kpi dashboard showing rent due today rent
Occupancy rate is your most important number - that's what pays the bills. Track average rent per unit and how often tenants leave too. Days between tenants matters more than you'd think, trust me on that one. Revenue stuff like total income and collection rates are obvious must-haves. Maintenance costs per unit will surprise you if you're not watching. Net operating income ties it all together. If you're marketing vacant units, lead conversion tells you whether your ads actually work or you're just throwing money away. Start there and add more later.
Honestly, dashboards are a game changer compared to drowning in spreadsheet hell. You'll spot patterns instantly - like occupancy dropping in winter or certain properties bleeding money. Heat maps are clutch for comparing locations side by side. Bar charts work great for comparisons, line graphs show trends over time. I'd start with whatever metrics stress you out most when you're trying to explain them to investors (that's always my test). Way easier to point at a colorful chart than scroll through endless rows of numbers.
Honestly, tenant retention is huge for your cash flow. Every time someone bounces, you're stuck with vacancy costs, finding new tenants, marketing - it adds up quick. Keep people happy and you avoid those income gaps completely. Long-term tenants also treat the place better since they're not just passing through. I'd check your numbers monthly but shoot for 85%+ retention annually. Below 80%? Something's wrong. Figure out why people are bailing - maybe it's maintenance issues or rent hikes - and fix it before more leave.
Honestly, occupancy rate is your make-or-break number. Empty units just bleed money - you're still paying mortgage and upkeep but getting zero income. Aim for 85-90% minimum or you're basically throwing cash away. That said, don't get so obsessed that you never raise rents. Sometimes it's worth accepting slightly lower occupancy to bump up what you're charging. Check what other landlords in your area are hitting first though. Then pick a threshold where if you drop below it, you know something's gotta change.
A KPI dashboard basically gives you all the historical data to spot trends in your rental income. Track stuff like occupancy rates, average rent per unit, and tenant turnover. Honestly, seasonal patterns are huge - you'll see which months are your money makers and when vacancies typically hit. Rate changes and how they affect demand become super obvious too. Way better than just winging it with forecasts, you know? I'd pull at least 12-24 months of data first to see your baseline patterns. Then factor in any renovations or market shifts you've got planned.
Dude, tracking how long tenants stick around is huge for figuring out if your property's actually working. Longer stays mean you're nailing the maintenance, pricing, whatever. Short stays? Something's off. Turnover costs will kill you - I learned this the hard way. Marketing, cleaning, empty units bleeding money. A good dashboard catches these patterns early so you can fix problems before they wreck your cash flow. You can compare different properties, see which ones actually perform. Set up alerts when tenant duration tanks below your target. Trust me, catching it early saves tons of headaches later.
Break down response times by urgency - emergency (24hrs), urgent (3 days), routine (7 days). Show it as metric tiles plus trend charts so you can catch patterns. Color-coding is clutch: red for overdue, yellow for close deadlines, green for on-time. Most property managers I know swear by the visual alerts since you can instantly spot problem areas. Oh, and definitely break it down by maintenance type or building if you've got multiple properties. That way you'll see if certain issues or locations keep causing headaches.
Cash flow is honestly the big one - that's your monthly rent minus expenses hitting your actual bank account. You'll also want to watch your cap rate (net income divided by property value) and vacancy rate. Oh, and debt service coverage ratio shows if rent actually covers your mortgage, which is pretty critical obviously. ROI and cash-on-cash return help you see if you're doing better than just throwing money in the stock market or whatever. I'd set up some kind of alert system when these numbers dip below where you want them. Trust me, catching problems early saves you so much headache later.
Honestly, KPIs are a game-changer because they stop you from making emotional decisions with your money. Instead of guessing, you'll actually see which properties are crushing it and which ones are bleeding cash. Occupancy rates and ROI tell the real story - I learned this the hard way on my second rental! Vacancy rates especially will warn you before you buy into a sketchy area. Your dashboard catches problems early, like when maintenance costs start climbing or rent isn't growing in certain neighborhoods. Compare your best performers to the duds and you'll spot patterns fast.
Start with the big three: occupancy rate, average rent, and cash flow. Everything should be visible without endless scrolling - honestly, if I have to hunt for basic numbers, I'm already annoyed. Group similar stuff together and use consistent colors so it actually makes sense. Auto-updating is crucial unless you enjoy playing with spreadsheets at 7am (you don't). Here's the thing though - don't go crazy trying to fit every metric on one screen. Six to eight key indicators max. You can always add more once everyone's used to it, but cramming everything in from day one just creates a mess nobody wants to look at.
Honestly, these dashboards are game-changers for spotting stuff before it hits you. You can see vacancy rates creeping up in specific areas, rent prices shifting, or those weird seasonal patterns that always catch people off guard. Way better than drowning in Excel sheets - the visual charts actually make sense of the chaos. Turnover spikes become obvious before they wreck your cash flow. Set up automated reports though, because nobody remembers to check this stuff when everything's running smooth. You'll catch which property types are trending up too, which is super useful for planning ahead.
Tableau and Power BI are your best bet for building the actual dashboard - both are pretty user-friendly for visualizations. APIs can automatically pull data from your property management software and accounting systems, which honestly saves you from going insane with manual updates. Most dashboards fail because people get tired of entering data by hand. Zapier works great when your platforms don't play nice together. IoT sensors for occupancy tracking are cool but maybe overkill at first? Start with one solid connection and expand from there.
Honestly, start simple with just 3-4 key things so you don't drown in numbers. Track how fast maintenance gets done, tenant complaint rates, and renewal percentages - these catch problems early. Response times are huge. If it's taking forever to fix stuff, people get pissed fast. Set up alerts when your satisfaction scores dip below whatever baseline you pick. The visual dashboard thing is actually pretty cool because you'll spot patterns, like if everyone's complaining about the same issue or certain properties are consistently slow. Don't forget communication frequency and feedback scores too.
Focus on vacancy rates, rent collection percentages, and how fast they handle maintenance requests - that's your holy trinity right there. Tenant retention is massive because turnover will drain your wallet fast. Look at their fee transparency too, some companies love hiding costs until later. Emergency repair response tells you a lot about how they actually operate. Property condition reports and how often they send financials matter way more than I initially thought when I started. Make a simple scorecard, weight what matters most for your situation. Way easier to pick when you've got everything laid out instead of going in circles.
So for KPIs, you gotta match them to your property type - they're totally different beasts. Residential is all about occupancy rates, rent per sqft, turnover, and maintenance costs per unit. Commercial? Focus on lease expiration schedules, CAM recoveries, tenant credit scores, and NOI margins instead. Honestly, the business models couldn't be more opposite - residential is high volume with quick turnover while commercial is about long-term stability. Oh, and timeframes matter since commercial leases run way longer. Pick your top 3-5 drivers for each type first, then build everything around those. Way easier than trying to force the same metrics on both.
-
Unique design & color.
-
Easily Editable.