


Risk Management Module Powerpoint Presentation Slides





Try Before you Buy Download Free Sample Product
 Impress Your
 Audience
 100%
100% Editable
 Save Hours
 of Time


Our Risk Management Module Powerpoint Presentation Slides ensure you don't lift a finger. They handle daily chores with ease.
People who downloaded this PowerPoint presentation also viewed the following :
Content of this Powerpoint Presentation
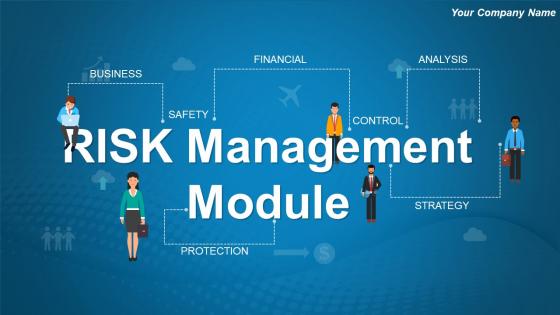
Slide 1: This slide introduces Risk Management Module. State Your Company Name and get started.
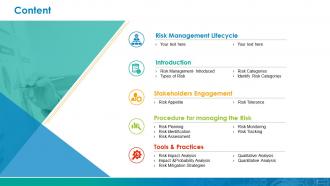
Slide 2: This slide showcases Content with the following points- Risk Management Lifecycle, Introduction, Risk Management- Introduced, Types of Risk, Risk Categories, Identify Risk Categories, Procedure for managing the Risk, Risk Planning, Risk Identification, Risk Assessment, Risk Monitoring, Risk Tracking, Stakeholders Engagement, Risk Appetite, Risk Tolerance, Tools & Practices, Risk Impact Analysis, Impact &Probability Analysis, Risk Mitigation Strategies, Qualitative Analysis, Quantitative Analysis.
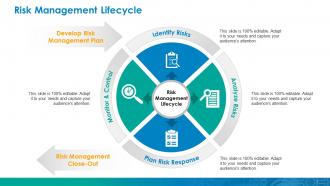
Slide 3: This slide showcases Risk Management Lifecycle displaying- Develop Risk Management Plan, Risk Management Close-Out, Risk Management Lifecycle, Identify Risks, Plan Risk Response, Analyze Risks, Monitor & Control.
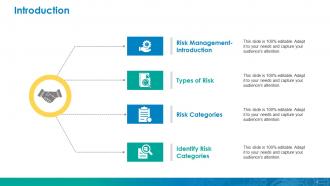
Slide 4: This slide showcases Introduction Risk Management- Introduction, Types of Risk, Risk Categories, Identify Risk Categories.
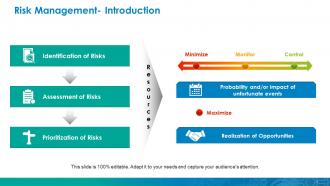
Slide 5: This slide showcases Risk Management- Introduction Resources, Assessment of Risks, Identification of Risks, Prioritization of Risks, Minimize, Monitor, Control, Realization of Opportunities, Probability and/or impact of unfortunate events, Maximize.
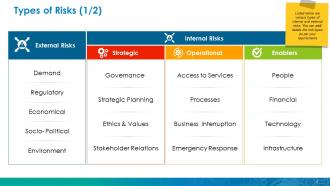
Slide 6: This slide shows Types of Risks (1/2) such as- External Risks: Demand, Regulatory, Economical, Socio- Political, Environment. Internal Risks:: Strategic: Governance, Strategic Planning, Ethics & Values, Stakeholder Relations. Operational: Access to Services, Processes, Business Interruption, Emergency Response. Enablers: People, Financial, Technology, Infrastructure. Listed below are various types of internal and external risks.
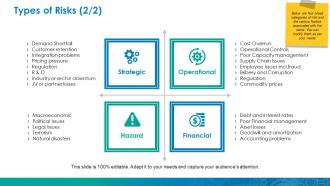
Slide 7: This slide shows Types Of Risks in matrix form with the subheadings- Operational: Cost Overrun, Operational Controls, Poor Capacity management, Supply Chain Issues, Employee Issues incl. fraud, Bribery and Corruption, Regulation, Commodity prices. Strategic: Demand Shortfall, Customer retention, Integration problems, Pricing pressure, Regulation, R & D, Industry or sector downturn, JV or partner losses. Financial: Debt and interest rates, Poor Financial management, Asset losses, Goodwill and amortization, Accounting problems. Hazard: Macroeconomic, Political Issues, Legal Issues, Terrorism, Natural disasters.
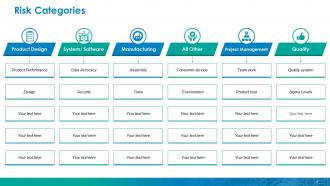
Slide 8: This slide shows Risk Categories with the following subheadings- Product Design: Product Performance, Design. System/ Software: Data Accuracy, Security. Manufacturing: Assembly, Tools. All Other: Consumer service, Environment. Project Management: Team work, Product cost. Quality: Quality system, Sigma Levels.
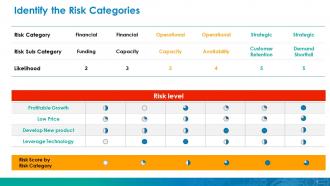
Slide 9: This slide displays Identify The Risk Categories with- Risk Score by Risk Category, and Risk level
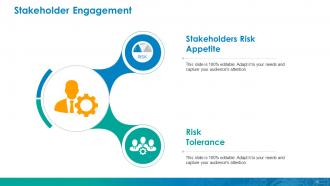
Slide 10: This slide shows Stakeholder Engagement with- Stakeholders Risk Appetite, Risk Tolerance.
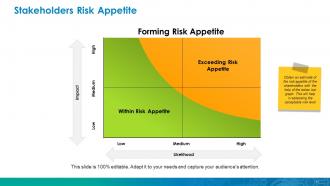
Slide 11: This slide shows Stakeholders Risk Appetite matrix showing Forming Risk Appetite in terms of impact and likelihood.
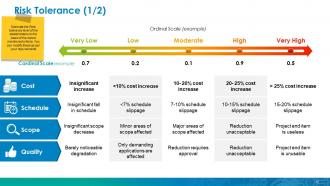
Slide 12: This slide shows Risk Tolerance table with Cost, Schedule, Scope, and Quality as subheadings in terms of ordinal scale of- Very Low, Very High, Low, Moderate, High.
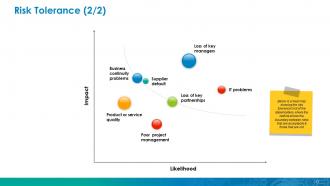
Slide 13: This slide shows a Risk Tolerance Bubble graph showing- Business Continuity Problems, Supplier Default, Loss Of Key Partnerships, IT Problems, Poor Project Management, Product Or Service Quality, Loss Of Key Managers.
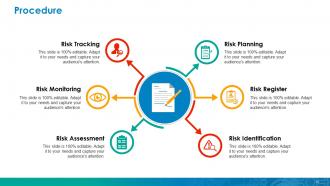
Slide 14: This slide shows Procedure displaying- Risk Planning, Risk Register, Risk Identification, Risk Tracking, Risk Monitoring, Risk Assessment.
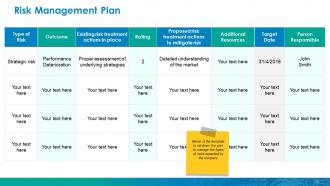
Slide 15: This slide showcases Risk Management Plan in tabular form showing- Type Of Risk, Outcome, Existing Risk Treatment Actions In Place, Rating, Additional Resources, Target Date, Person Responsible, Proposed Risk Treatment Actions To Mitigate Risk.
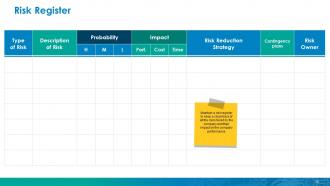
Slide 16: This slide shows Risk Register showcasing- Type Of Risk, Description Of Risk, Risk Reduction Strategy, Contingency Plans, Risk Owner, Probability, Impact.
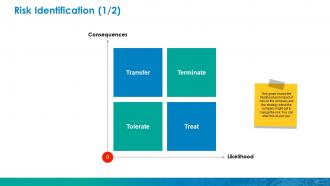
Slide 17: This slide presents a Risk Identification matrix showing- Terminate, Treat, Tolerate, Transfer in terms of Consequences & Likelihood.
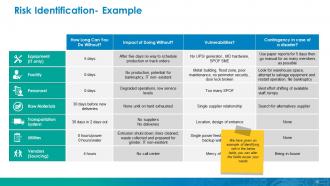
Slide 18: This slide showcases Risk Identification- Example with- How Long Can You Do Without? Impact of Doing Without? Vulnerabilities? Contingency in case of a disaster? Utilities, Equipment (IT only), Facility, Personnel, Transportation System, Vendors (Sourcing), Raw Materials. We have given an example of identifying risk in the below table, you can alter the fields as per your needs.
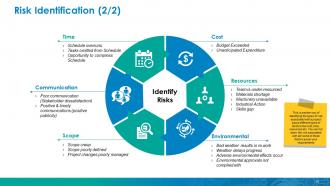
Slide 19: This slide showcases Risk Identification (2/2) with the following subheadings- Cost: Budget Exceeded, Unanticipated Expenditure. Resources: Team is under-resourced, Materials shortage, Machinery unavailable, Industrial Action, Skills gap. Environmental: Bad weather results in re-work, Weather delays progress, Adverse environmental effects occur, Environmental approvals not complied with. Time: Schedule overruns, Tasks omitted from Schedule, Opportunity to compress Schedule. Communication: Poor communication (Stakeholder dissatisfaction), Positive & timely communications (positive publicity). Scope: Scope creep, Scope poorly defined, Project changes poorly managed.
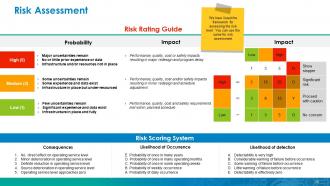
Slide 20: This slide shows Risk Assessment with Risk Rating Guide displaying- Impact: Performance, quality, cost or safety impacts resulting in major redesign and program delay, Performance, quality, cost and/or safety impacts resulting in minor redesign and schedule adjustment, Performance, quality, cost and safety requirements met within planned schedule. Probability: Major uncertainties remain, No or little prior experience or data, Infrastructure and/or resources not in place, Some uncertainties remain, Some experience and data exist, Infrastructure in place but under-resourced, Few uncertainties remain, Significant experience and data exist, Infrastructure in place and fully, and Likelihood of Occurrence: E. Probability of once in many years D. Probability of once in many operating months C. Probability of once in some operating weeks B. Probability of weekly occurrence A. Probability of daily occurrence Likelihood of detection: Detectability is very high, Considerable warning of failure before occurrence, Some warning of failure before occurrence, Little warning of failure before occurrence, Detectability is effectively zero Consequences: No. direct effect on operating service level, Minor deterioration in operating service level, Definite reduction in operating service level, Source deterioration in operating service level, Operating service level approaches zero. as Risk Scoring System.
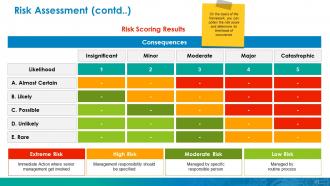
Slide 21: This slide shows Risk Assessment with Risk Scoring Results table in terms of- Insignificant, Minor, Moderate, Major, Catastrophic, Consequences, Likelihood. A. Almost Certain, B. Likely, C. Possible, D. Unlikely, E. Rare. On the basis of the framework, you can obtain the risk score and determine its likelihood of occurrence.
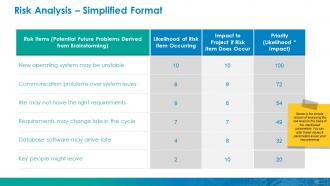
Slide 22: This slide presents Risk Analysis – Simplified Format in tabular form showing- New operating system may be unstable, Communication problems over system issues, We may not have the right requirements, Requirements may change late in the cycle, Database software may arrive late, Key people might leave, Likelihood of Risk Item Occurring, Impact to Project if Risk Item Does Occur, Priority (Likelihood * Impact) as Risk Items (Potential Future Problems Derived from Brainstorming).
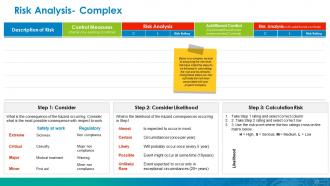
Slide 23: This slide Risk Analysis- Complex showcasing- Description of Risk, Risk Analysis, Risk Rating, Control Measures, (Detail any existing Controls), Risk Rating, Risk Analysis(with additional controls), Additional Control, (Detail additional to be implemented Controls).
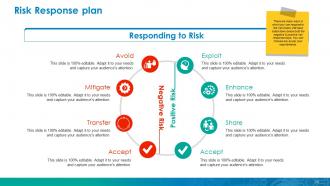
Slide 24: This slide shows Risk Response Plan showcasing- Responding to Risk consisting of- Mitigate, Avoid, Transfer, Accept, Exploit, Enhance, Share, Accept, Negative Risk, Positive Risk.
Slide 25: This slide shows Risk Response Matrix displaying- Interface Problems, User Backlash, System Freezing, Hardware Malfunctioning, Risk Event, Response, Contingency Plan, Trigger, Who is responsible. Once you estimate the risk and plan the response. The next step is to prepare a detailed response matrix stating the contingency plan, its duration and the person responsible.
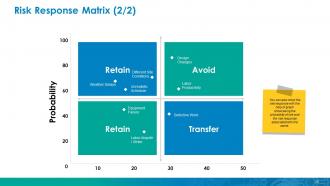
Slide 26: This slide shows a Risk Response Matrix displaying- Avoid: Design Changes Different Site Conditions Labor Productivity Unrealistic Schedule Transfer, Retain: Weather Delays, Defective Work, Equipment Failure, Labor dispute / Strike.
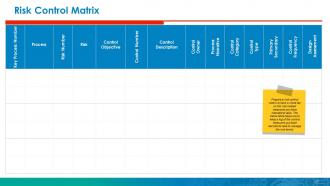
Slide 27: This slide shows a Risk Control Matrix.
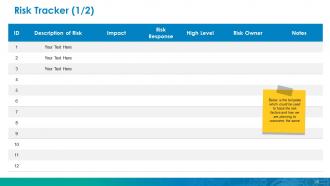
Slide 28: This slide showcases Risk Tracker in tabular form.
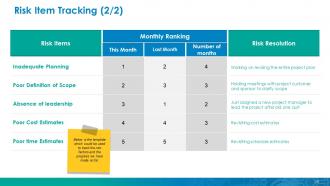
Slide 29: This slide shows Risk Item Tracking with- Risk Items, Risk Resolution, Monthly Ranking.
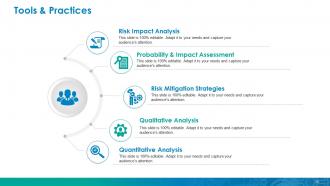
Slide 30: This slide shows Tools & Practices with the following subheadings- Quantitative Analysis, Qualitative Analysis, Risk Mitigation Strategies, Probability & Impact Assessment, Risk Impact Analysis.
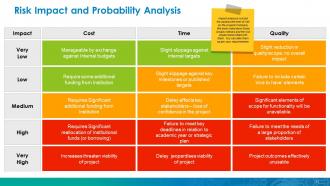
Slide 31: This slide shows Risk Impact and Probability Analysis showcasing- Cost: Manageable by exchange against Internal budgets, Increases threaten viability of project, Require some additional funding from Institution, Requires Significant additional funding from Institution, Requires Significant reallocation of Institutional funds (or borrowing). Time: Slight slippage against internal targets, Delay jeopardises viability of project, Slight slippage against key milestones or published targets, Deley affects key stakeholders – loss of confidence in the project, Failure to meet key deadlines in relation to academic year or strategic plan. Quality: Slight reduction in quality/scope, no overall impact, Project outcomes effectively unusable, Failure to include certain ‘nice to have’ elements, Significant elements of scope for functionality will be unavailable, Failure to meet the needs of a large proportion of stakeholders with Impact Scale.
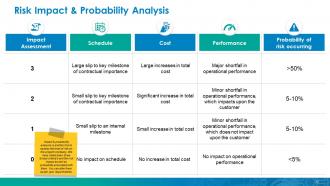
Slide 32: This slide presents Risk Impact & Probability Analysis with- Performance, Probability Of Risk Occurring, Schedule, Impact Assessment, Cost.
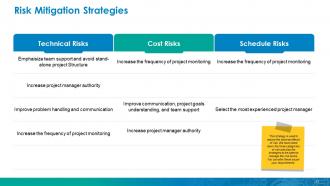
Slide 33: This slide shows Risk Mitigation Strategies showcasing- Technical Risks, Cost Risks, Schedule Risks.
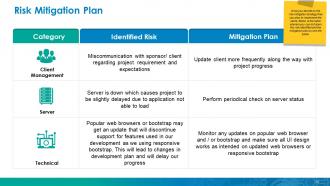
Slide 34: This slide presents Risk Mitigation Plan with- Category, Identified Risk, Mitigation Plan.
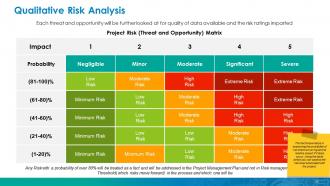
Slide 35: This slide presents Qualitative Risk Analysis table.
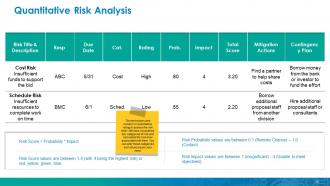
Slide 36: This slide presents Quantitative Risk Analysis table.
Slide 37: This is a Coffee break image slide to halt. You can change the slide content as per need.
Slide 38: This slide is titled Charts and Graphs to move forward. You can alter the slide content as per need.
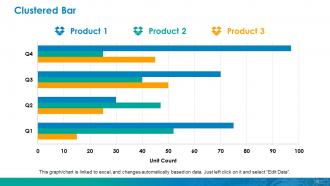
Slide 39: This is a Clustered Bar slide. State specifications, comparison of products/entities here.
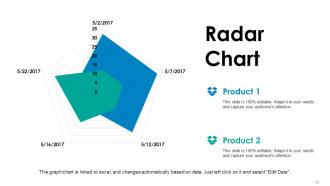
Slide 40: This is a Radar chart slide. State specifications, comparison of products/entities here.
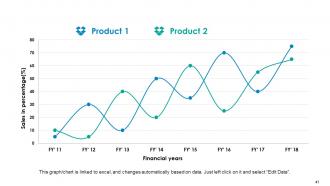
Slide 41: This is a Line chart slide. State specifications, comparison of products/entities here.
Slide 42: This slide is titled Additional Slides to move forward. You can alter the slide content as per need.
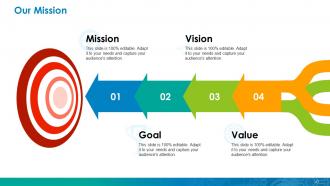
Slide 43: This is Our Mission slide with Vision, Mission, Value and Goal. State them here.
Slide 44: This is Our Team slide to state team specifications, information, structure etc.
Slide 45: This is an About Us slide. State company/business specifications here.
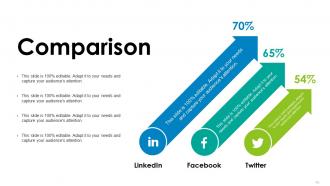
Slide 46: This is a Comparison slide in a creative arrow imagery form to compare two entities etc.
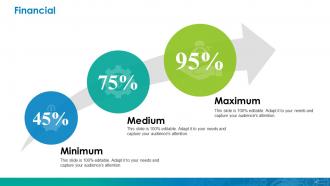
Slide 47: This is a Financial score slide. State financial aspects, information etc. here.
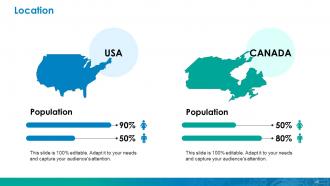
Slide 48: This is a Location slide of world map image to show global presence, growth etc.
Slide 49: This is a Quotes slide. Convey message, beliefs etc. here. You may also change the entire content as desired.
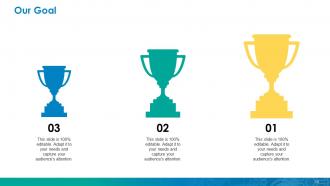
Slide 50: This is an Our Goal slide. State your goals, aspirations etc. here
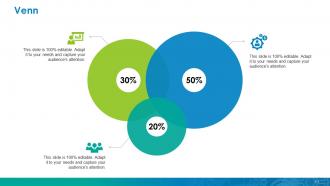
Slide 51: This is a Venn diagram image slide. State information, specifications etc. here.
Slide 52: This is a Bulb or Idea image slide to state information, specifications etc.
Slide 53: This is a Magnifying Glass image slide to show information, specifications etc.
Slide 54: This is a Thank You slide with Address# street number, city, state, Contact Number, Email Address.
Risk Management Module Powerpoint Presentation Slides with all 54 slides:
Your team will begin to bond closer. Enhance their EQ with our Risk Management Module Powerpoint Presentation Slides.










FAQs for Risk Management Module
Look, it's actually pretty simple - figure out what could blow up in your face, then decide how bad that would be and how likely it is. Once you know that, you've got four moves: dodge it completely, put safeguards in place, get insurance or something to shift the risk, or just roll with it if fixing it costs more than it's worth. Here's what most people screw up though - they think it's a one-time thing. Your risks change all the time, so you gotta keep checking back. Oh, and don't try to tackle everything at once. Start with the stuff that'll really hurt you first.
Honestly, just start by mapping out your main business processes and think through what could go sideways at each step. Pull in people from different departments - finance folks will catch stuff IT misses and vice versa. Create a simple grid rating each risk by how likely it is vs. how much damage it'd cause. Focus on the high-high combos first, obviously. Oh, and don't ignore outside threats like supply chain issues or new regulations that could mess things up. The trick is doing this every quarter, not just once. New risks pop up constantly these days.
Honestly, good stakeholder communication can make or break your whole risk management thing. People need to know what's coming down the pipeline - potential problems, your game plan, changes that'll hit them. Regular check-ins work way better than waiting for disaster to strike. Your stakeholders actually catch stuff you miss too since they're seeing different angles of the business. Just don't bury them in technical garbage - keep updates simple and digestible. I've seen too many projects fail because someone thought they could wing the communication part. Being upfront from the start saves everyone headaches later.
Honestly, automation is a game-changer for this stuff. You can set up systems to collect data automatically and run predictive analytics that spot patterns way better than doing it by hand. Real-time monitoring catches risks as they happen, and dashboards give you that instant overview of everything going on. Machine learning is getting ridiculously good at finding connections you'd never notice. Cloud platforms help centralize all your risk data from different teams too - makes everything way cleaner. I'd start by looking at what you're doing manually now and figure out where tech could speed things up or catch problems earlier.
Honestly, the worst thing companies do is treat risk management like some annual paperwork drill. They focus on the obvious stuff but totally miss the weird edge cases that actually bite you. Don't let your team think it's just the compliance person's problem either - everyone needs to own this. And for the love of god, actually update your plans when things change! I've seen so many outdated risk registers it's not even funny. Make reviews part of your regular routine, get different people involved, and track if your fixes actually work. Set a quarterly reminder or you'll forget.
So basically you want to make a risk matrix - just plot everything on a grid with likelihood vs impact. The high-high stuff? Yeah, that's your "drop everything" pile. Honestly, most people suck at estimating likelihood though - we're either doom-scrolling or wearing rose-colored glasses. Medium risks need some kind of plan, even if it's just checking on them monthly. Low risks can sit in a spreadsheet somewhere until quarterly reviews (if you even do those lol). Oh and actually update this thing regularly since everything changes so fast these days.
So qualitative is basically those "high, medium, low" ratings or red/yellow/green charts - way easier to do quickly. Quantitative actually crunches real numbers and gives you exact percentages and dollar amounts. Most teams I know just stick with qualitative because honestly, who has time to gather all that historical data? But if you need to justify spending money or rank risks properly, numbers don't lie. My advice? Start with the quick qualitative stuff to get a feel for everything, then get serious with the math on your worst risks.
Make risk management part of everyone's day-to-day, not just buried in some manual nobody reads. Use real stories from your industry during training - people actually remember those. Don't punish employees for speaking up about problems they spot. Honestly, nothing kills risk awareness faster than shooting the messenger. Set up easy ways for people to report issues and celebrate early catches. Show your team that managing risks protects their work too, not just the company's assets. Oh, and definitely reward people who flag potential problems before they blow up.
Honestly, it depends totally on what industry you're in. Financial companies get hit with Basel III and Dodd-Frank stuff. Healthcare? You're looking at FDA rules plus HIPAA. Manufacturing deals with OSHA and environmental compliance - energy has its own nightmare of regulations too. First thing is figuring out who actually regulates your sector. Then you map out what they want: formal risk assessments, written policies, regular reports, board involvement. The fines are no joke if you mess up. Your industry association probably has checklists already made. Saves you from digging through tons of regulatory documents yourself.
Get your leadership on board first - seriously, you'll be banging your head against the wall otherwise. Look at what risk stuff you're already doing that actually works. Don't blow everything up and start over. Instead, weave ISO 31000 into how people already make decisions. Nobody wants another fancy framework gathering dust on a shelf, right? Train your teams but keep it real and practical. I'd start with one area where you can show some quick wins - builds momentum and makes the whole thing feel less overwhelming. The goal is making it feel natural, not like more paperwork hell.
Honestly, treat it like a security system for your business - set up automated alerts that ping you when something's off. Monthly or quarterly check-ins work pretty well, and definitely assign different people to watch specific risk areas. Otherwise stuff just gets missed, you know? I'd integrate this into meetings you're already having rather than creating yet another thing to remember. Risk registers are useful (boring but useful), and most project management tools can handle the documentation side. The whole point is making it automatic instead of scrambling when things go sideways.
Think of crisis management as what happens when your risk planning totally falls apart. Risk management is all about spotting problems early and stopping them. Crisis management? That's damage control when shit actually hits the fan. Here's the thing though - your risk assessments should feed directly into your crisis playbook. If you've already mapped out what could go wrong, you can prep responses ahead of time. Way better than running around like headless chickens when everything's on fire. Honestly, most companies skip this connection and then wonder why they're so unprepared when disasters strike.
Honestly, executives just want the bottom line upfront - skip the technical stuff. Start with a simple template: what's the risk, how likely is it, what'll it cost us (actual dollars if you can), and how we're fixing it. I made this mistake once with a massive presentation that got shut down after like 3 slides. Monthly dashboards work way better than long reports. Just highlight new high-priority stuff or anything that's changed status. Oh, and always throw in specific deadlines and next steps so they know you're actually handling it, not just identifying problems.
So basically you're doing "what if" prep work before stuff hits the fan. Pick like 3-4 scenarios that could mess with your business - some probable, some wild card situations. Then figure out what you'd actually DO in each case. Honestly, most companies skip this step and just wing it when problems come up, which is... not great. It's kinda like those fire drills we hated in school, except for business risks. Your team gets better at spotting threats and you're not scrambling to make decisions when you're already stressed. Start small - just brainstorm a few situations and talk through responses.
Honestly, start simple with 3-4 metrics that actually matter to your business. Track your risk exposure ratios and how often incidents happen. Time-to-resolution is huge too - nobody wants problems dragging on forever. Loss ratios tell you a lot, but near-miss reporting rates? That's where you see if people feel safe speaking up or if they're just staying quiet. Also watch how long risks sit in your register without anyone doing anything about it. Oh, and compare your risk appetite against actual exposure - you'd be surprised how often companies drift outside their comfort zone without realizing it. Don't drown yourself in data you won't use.
-
5
-
Out of the box and creative design.
-
Nice and innovative design.