


Sales And Operations Dashboard To Drive Effective Productivity




Try Before you Buy Download Free Sample Product
 Impress Your
 Audience
 100%
100% Editable
 Save Hours
 of Time


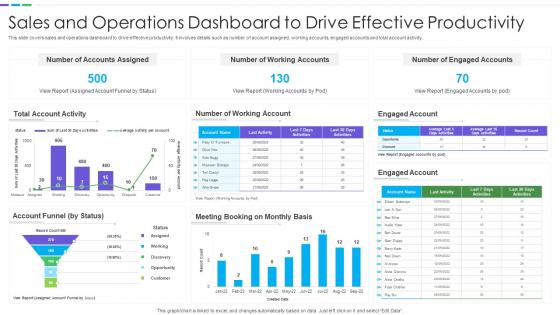
This slide covers sales and operations dashboard to drive effective productivity. It involves details such as number of account assigned, working accounts, engaged accounts and total account activity.
People who downloaded this PowerPoint presentation also viewed the following :
Sales And Operations Dashboard To Drive Effective Productivity with all 7 slides:
Use our Sales And Operations Dashboard To Drive Effective Productivity to effectively help you save your valuable time. They are readymade to fit into any presentation structure.





FAQs for Sales And Operations Dashboard To
Essential metrics include conversion rates, sales velocity, pipeline health, quota attainment, and customer acquisition costs, alongside lead-to-close ratios and territory performance indicators. These comprehensive dashboards enable sales teams to identify bottlenecks, optimize resource allocation, and accelerate deal progression, with many organizations finding that real-time visibility ultimately delivers improved forecasting accuracy and enhanced revenue growth.
Real-time data visualization enhances sales team decision-making by providing instant access to performance metrics, pipeline analytics, and customer behavior patterns, enabling faster response to market changes. Through interactive dashboards, sales managers can identify underperforming territories, optimize resource allocation, and coach representatives more effectively, ultimately delivering improved conversion rates and revenue growth.
Effective sales operations dashboard tools include Salesforce Analytics, HubSpot Dashboard, Tableau, Microsoft Power BI, and Pipedrive Insights. These platforms streamline data visualization by integrating CRM systems, automating reporting processes, and delivering real-time performance metrics, with many sales teams finding that comprehensive dashboards enhance forecasting accuracy and accelerate decision-making across territories.
Ensuring data accuracy requires implementing automated data validation rules, establishing standardized data entry protocols, conducting regular audits, and integrating real-time synchronization across CRM systems. Through centralized data governance and consistent formatting standards, sales teams minimize errors, enhance reporting reliability, and maintain dashboard integrity, with many organizations finding that automated validation processes ultimately deliver more trustworthy insights and faster decision-making.
Automation streamlines dashboard maintenance by automatically syncing CRM data, updating pipeline metrics, refreshing performance indicators, and generating real-time reports without manual intervention. Through automated data integration, sales teams reduce administrative overhead, minimize human error, and ensure consistent accuracy across all metrics, while enabling managers to focus on strategic decision-making rather than data compilation tasks.
A Sales Operations Dashboard supports sales forecasting by providing real-time visibility into pipeline metrics, lead conversion rates, deal progression stages, and historical performance trends. These comprehensive analytics enable sales teams to identify bottlenecks, prioritize high-value opportunities, and adjust strategies proactively, while many organizations find that centralized pipeline visibility ultimately delivers more accurate forecasts and improved revenue predictability.
Best practices for designing intuitive sales operations dashboards include prioritizing key metrics visibility, implementing clean visual hierarchy, ensuring mobile responsiveness, customizing role-based views, and integrating real-time data feeds. These design principles streamline decision-making by reducing cognitive load, accelerating data interpretation, and enabling quick performance identification, with many sales organizations finding that intuitive dashboards ultimately enhance team productivity and strategic responsiveness.
Integrating CRM data enhances Sales Operations Dashboards by providing real-time customer insights, automating lead tracking, and centralizing sales pipeline visibility across teams. This strategic combination enables sales managers to identify bottlenecks faster, optimize resource allocation, and deliver more accurate forecasting, with many organizations finding that unified data ultimately streamlines decision-making and accelerates revenue growth.
Sales cycle length analysis reveals bottlenecks in lead qualification, proposal development, negotiation stages, and closing processes, while identifying top-performing sales representatives and successful deal patterns. Through dashboard visualization, organizations streamline their sales strategies, optimize resource allocation, and reduce average deal closure times, with many companies finding that shorter cycles correlate directly with improved revenue forecasting and enhanced customer acquisition efficiency.
A Sales Operations Dashboard improves alignment by providing shared visibility into lead quality, conversion rates, pipeline progression, attribution tracking, and campaign performance metrics. This transparency enables both teams to identify which marketing activities generate qualified leads, optimize handoff processes, and coordinate messaging strategies, ultimately reducing friction between departments and accelerating revenue growth through collaborative data-driven decision making.
Heat maps in Sales Operations Dashboards visualize performance density through color-coded data, highlighting high and low-performing territories, products, time periods, and sales representatives at a glance. This technique enables sales managers to quickly identify regional opportunities, seasonal trends, and resource allocation needs, while streamlining performance reviews and strategic planning processes for enhanced operational efficiency.
Implementing a Sales Operations Dashboard presents challenges including data integration complexity, user adoption resistance, and accuracy concerns across multiple systems. However, these obstacles can be overcome through phased rollouts, comprehensive training programs, and establishing clear data governance protocols, with many organizations finding that starting with core metrics and gradually expanding functionality delivers better user engagement and ultimately stronger sales performance insights.
Historical data in a Sales Operations Dashboard enables predictive forecasting, trend identification, and performance pattern analysis to inform strategic decision-making. By analyzing past customer behaviors, seasonal fluctuations, and conversion rates, sales teams can optimize territory allocation, refine targeting strategies, and adjust resource deployment, ultimately delivering more accurate forecasts and competitive advantage.
Key sales productivity KPIs include conversion rates, average deal size, sales cycle length, activity metrics, and quota attainment percentages. These metrics streamline performance evaluation by identifying top performers, revealing pipeline bottlenecks, and optimizing resource allocation, with many sales organizations finding that comprehensive dashboard monitoring ultimately delivers improved forecasting accuracy and accelerated revenue growth.
A Sales Operations Dashboard aids in identifying sales risks by tracking pipeline velocity, deal progression rates, quota attainment patterns, and performance anomalies across territories and representatives. Through real-time analytics and predictive modeling, sales managers can quickly spot declining conversion rates, stalled opportunities, and resource allocation gaps, enabling proactive interventions that ultimately minimize revenue losses and enhance forecast accuracy.
-
Fantastic collection. Loved how we can personalize these templates as per the requirements.
-
The best collection of PPT templates!! Totally worth the money.