


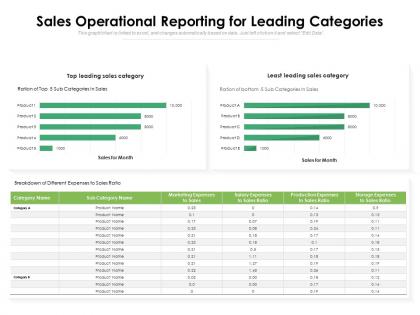
Sales operational reporting for leading categories




Try Before you Buy Download Free Sample Product
 Impress Your
 Audience
 100%
100% Editable
 Save Hours
 of Time


Brief applicants for the job with our Sales Operational Reporting For Leading Categories. Inform them of the criteria to be fulfilled.
People who downloaded this PowerPoint presentation also viewed the following :
Sales operational reporting for leading categories with all 2 slides:
Inform applicants of the criteria to be fulfilled with our Sales Operational Reporting For Leading Categories. Brief them about the job.
FAQs for Sales operational reporting
Key components of an effective sales report include revenue metrics, pipeline analysis, conversion rates, individual and team performance data, and forecasting insights. These elements streamline decision-making by identifying trends, tracking quota attainment, and highlighting growth opportunities, with many sales organizations finding that comprehensive reporting ultimately delivers improved accountability and strategic visibility across all revenue-generating activities.
Visualizations enhance sales data understanding by transforming complex numbers into clear charts, graphs, and dashboards that reveal patterns, trends, and performance gaps instantly. These visual tools enable sales teams to identify top-performing products, recognize seasonal fluctuations, and spot emerging opportunities quickly, ultimately delivering faster decision-making and improved strategic planning across organizations.
Sales forecasting serves as the predictive foundation of sales reporting, enabling organizations to anticipate revenue trends, identify potential gaps, and make informed resource allocation decisions. Through historical data analysis and market trend evaluation, sales teams can set realistic targets, adjust strategies proactively, and ultimately deliver more accurate quarterly projections and strategic planning insights.
Sales reporting frequency depends on business size, industry dynamics, and decision-making needs, with most organizations benefiting from daily activity tracking, weekly performance summaries, and monthly strategic reviews. This multi-tiered approach enables sales managers to address immediate pipeline issues, adjust weekly targets, and make strategic territory adjustments, ultimately delivering faster response times and improved forecasting accuracy.
Common sales reporting mistakes include inconsistent data collection, focusing solely on revenue metrics, delayed reporting cycles, ignoring pipeline health indicators, and failing to segment performance by territories or products. These oversights limit strategic decision-making capabilities, with many organizations finding that implementing standardized processes, balanced scorecards, and real-time dashboards ultimately delivers enhanced forecast accuracy and improved sales performance.
Sales reports can be tailored by customizing metrics, visualization formats, and detail levels to match each stakeholder's specific needs and decision-making responsibilities. Executive dashboards emphasize high-level KPIs and trends, while sales managers require territory performance and pipeline details, and individual representatives need personal quotas and activity tracking, ultimately enabling more strategic decision-making across organizational levels.
B2B sales reporting should prioritize metrics like sales cycle length, customer acquisition cost, deal size, pipeline velocity, and customer lifetime value, while B2C focuses on conversion rates, average order value, customer retention, and transaction volume. These different approaches reflect varying business models, with B2B companies tracking longer relationship-building processes and B2C organizations monitoring higher-frequency, shorter-cycle transactions for optimal performance.
CRM software streamlines sales reporting by automating data collection, centralizing customer interactions, and generating real-time analytics dashboards. Through integrated tracking systems, sales teams eliminate manual data entry, reduce reporting errors, and access instant performance metrics, while managers gain comprehensive pipeline visibility, ultimately enabling faster decision-making and strategic resource allocation across growing organizations.
Improving sales data accuracy requires implementing automated CRM systems, standardizing data entry protocols, conducting regular data audits, establishing clear reporting guidelines, and providing comprehensive staff training. These strategies streamline data collection processes while minimizing human error, with many organizations finding that consistent validation procedures and real-time monitoring ultimately deliver more reliable forecasting and enhanced decision-making capabilities.
Historical sales data enables organizations to identify patterns through trend analysis, seasonal fluctuation tracking, customer behavior assessment, and performance benchmarking across products, regions, and time periods. By analyzing this data, businesses can forecast demand, optimize inventory management, refine pricing strategies, and target high-potential market segments, ultimately delivering improved resource allocation and competitive advantage.
Sales reporting significantly impacts team performance by providing visibility into individual and collective results, identifying top performers and improvement areas, and enabling data-driven coaching decisions. Through comprehensive dashboards and analytics, sales managers can track quota attainment, pipeline health, and activity metrics, while teams gain clarity on goals and progress, ultimately driving accountability, motivation, and strategic focus that enhances overall revenue generation.
Sales reports help evaluate marketing campaign effectiveness by tracking lead conversion rates, revenue attribution, customer acquisition costs, and sales cycle changes tied to specific campaigns. Through detailed analytics, organizations can measure which marketing channels generate the highest-quality leads, identify campaign ROI across different segments, and optimize budget allocation, ultimately enabling data-driven marketing decisions that enhance overall sales performance.
Best practices for sales report presentations include visual data storytelling, interactive dashboards, clear performance metrics, executive summaries, and trend analysis charts. These approaches enhance clarity by streamlining complex data into digestible insights, while boosting engagement through compelling visuals and actionable recommendations, ultimately enabling sales teams to make faster strategic decisions and drive improved performance outcomes.
Regional sales reports focus on specific geographic territories, analyzing local market trends, territory-specific performance metrics, customer demographics, and area-based sales team effectiveness. While overall company reports aggregate all regions to show enterprise-wide performance, consolidated revenue streams, and strategic business outcomes, regional reports enable targeted market strategies, localized resource allocation, and territory optimization, with many organizations finding that this geographic segmentation delivers more precise forecasting and competitive positioning.
Sales reporting contributes to strategic planning and budgeting by providing historical performance data, identifying revenue trends, forecasting future sales potential, and revealing market opportunities or challenges. These insights enable organizations to allocate resources strategically, set realistic targets, and adjust business strategies, with many companies finding that comprehensive sales analytics ultimately delivers more accurate budgets and competitive advantage.
No Reviews