


Sales scorecard powerpoint presentation slides





Try Before you Buy Download Free Sample Product
 Impress Your
 Audience
 100%
100% Editable
 Save Hours
 of Time


Sales professionals can now take advantage of our custom Sales Scorecard PowerPoint Presentation Slides. This interactive PPT theme is developed using the most appropriate design elements to represent a balanced scorecard for sales. Our PowerPoint templates designers have included stunning graphics to build a visually-gripping sales dashboard. Consolidate region-wise actual sales vs target sales using the impressive data visualization tools included in our sales BSC PPT templates. These slides are designed to showcase information clearly without taking up too much room. This way you can neatly outline all the fundamentals of a sales balanced scorecard using this comprehensive PowerPoint deck. Bar graphs and pie-charts in this sales performance BSC PPT slideshow add to the overall aesthetic appeal. Highlighting best performers through sales representative management BSC layout given in this PowerPoint theme aids employee motivation. Illustrate weekly and monthly sales scorecards with margin and cost analysis using our eye-catching PPT deck. Download the sales management BSC PPT presentation and build a presentation within moments.
People who downloaded this PowerPoint presentation also viewed the following :
Content of this Powerpoint Presentation
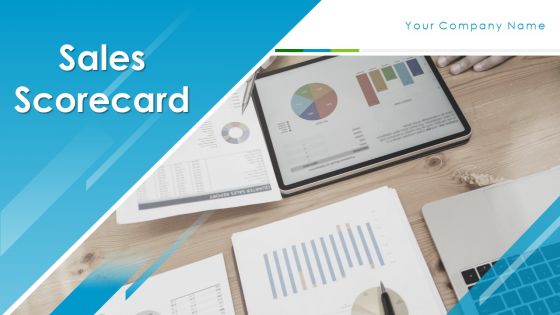
Slide 1: This slide displays Sales Scorecard. State Your Company name.
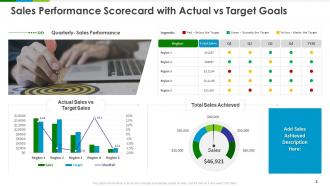
Slide 2: This slide shows Sales Performance Scorecard with Actual vs Target Goals
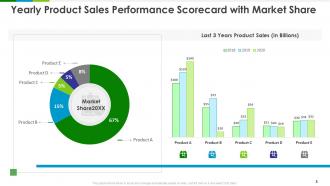
Slide 3: This slide showcases Yearly Product Sales Performance Scorecard with Market Share
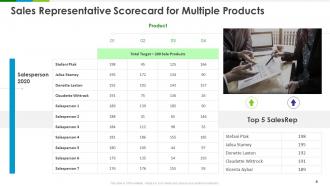
Slide 4: This slide depicts Sales Representative Scorecard for Multiple Products
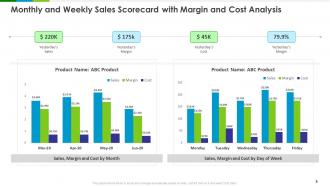
Slide 5: This slide shows Monthly and Weekly Sales Scorecard with Margin and Cost Analysis.
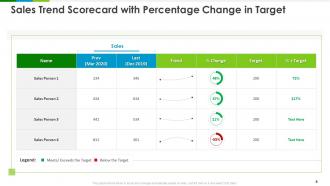
Slide 6: This slide presents Sales Trend Scorecard with Percentage Change in Target.
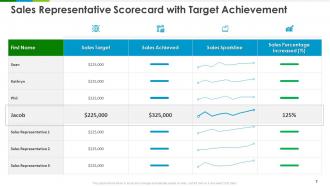
Slide 7: This slide showcases Sales Representative Scorecard with Target Achievement.
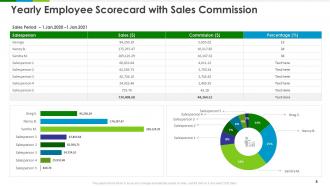
Slide 8: This slide highlights Yearly Employee Scorecard with Sales Commission.
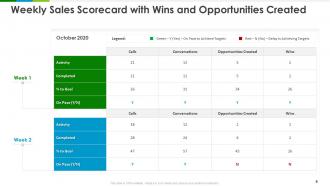
Slide 9: This slide presents Weekly Sales Scorecard with Wins and Opportunities Created.
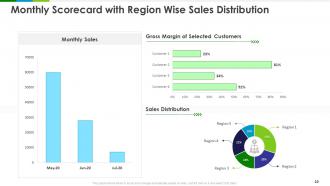
Slide 10: This slide shows Monthly Scorecard with Region Wise Sales Distribution.
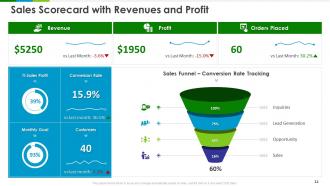
Slide 11: This slide showcases Sales Scorecard with Revenues and Profit
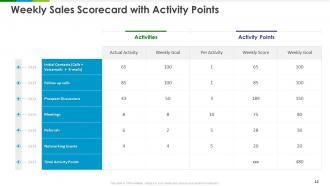
Slide 12: This slide represents Weekly Sales Scorecard with Activity Points.
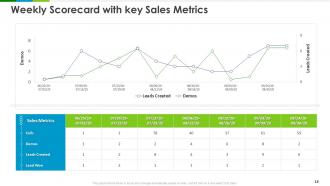
Slide 13: This slide showcases Weekly Scorecard with key Sales Metrics.
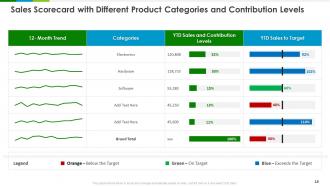
Slide 14: This slide shows Sales Scorecard with Different Product Categories and Contribution Levels.
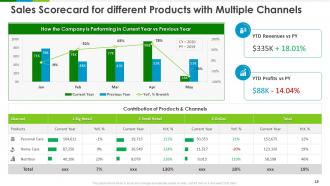
Slide 15: This slide showcases Sales Scorecard for different Products with Multiple Channels.
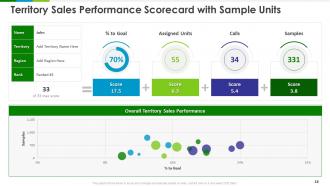
Slide 16: This slide displays Territory Sales Performance Scorecard with Sample Units
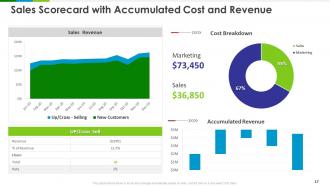
Slide 17: This slide displays Sales Scorecard with Accumulated Cost and Revenue.
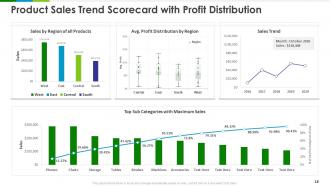
Slide 18: This slide represents Product Sales Trend Scorecard with Profit Distribution.
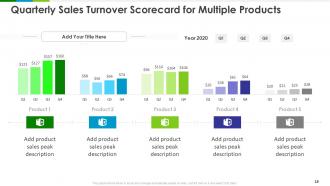
Slide 19: This slide displays Quarterly Sales Turnover Scorecard for Multiple Products
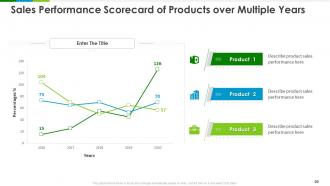
Slide 20: This slide represents Sales Performance Scorecard of Products over Multiple Years.
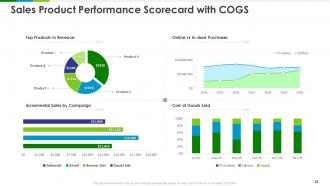
Slide 21: This slide displays Sales Product Performance Scorecard with COGS.
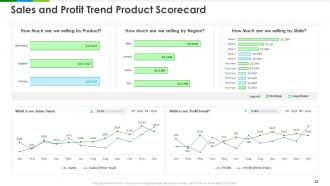
Slide 22: This slide shows Sales and Profit Trend Product Scorecard.
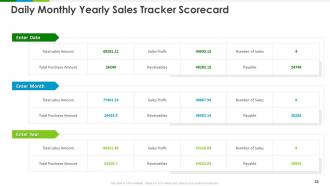
Slide 23: This slide displays Daily Monthly Yearly Sales Tracker Scorecard.
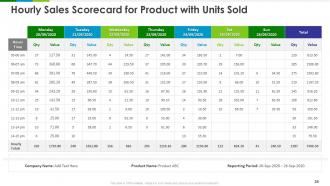
Slide 24: This slide displays Hourly Sales Scorecard for Product with Units Sold.
Slide 25: This slide depicts Sales Scorecard with Increase or Decrease in Unit Price.
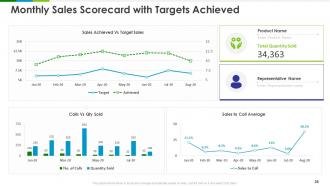
Slide 26: This slide displays Monthly Sales Scorecard with Targets Achieved
Slide 27: This is Icons Slide for Sales Scorecard.
Slide 28: This slide is titled as Additional Slides for moving forward.
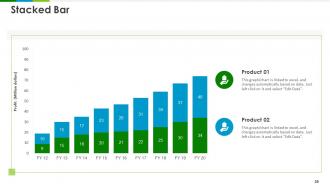
Slide 29: This slide represents Stacked Bar chart with product Comparison.
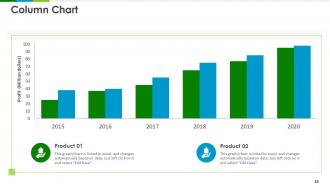
Slide 30: This slide displays Column Chart with different product comparison.
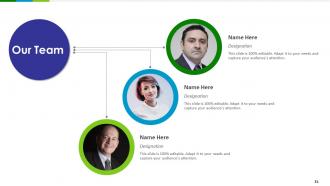
Slide 31: This is Our Team slide with Names and Designations.
Slide 32: This is About Us slide to showcase Company specifications.
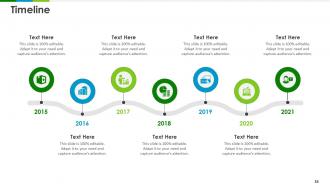
Slide 33: This slide shows Timeline process.
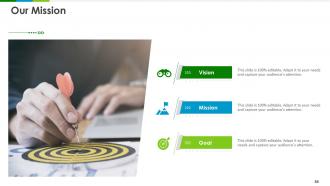
Slide 34: This slide displays Mission, Vision and Goals of the Company.
Slide 35: This slide displays Our Target.
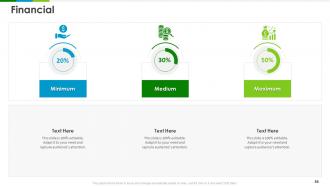
Slide 36: This is Financial slide. Showcase Finance related stuff.
Slide 37: This slide displays Our Target.
Slide 38: This is Thank You slide with Address, Contact number and Email address.
Sales scorecard powerpoint presentation slides with all 38 slides:
Use our Sales Scorecard Powerpoint Presentation Slides to effectively help you save your valuable time. They are readymade to fit into any presentation structure.




FAQs for Sales scorecard
A sales scorecard should include metrics like conversion rates, average deal size, sales cycle length, and customer acquisition cost to effectively measure team performance. These metrics, when tracked and analyzed, provide insights into areas of strength and weakness, enabling sales leaders to identify trends, optimize strategies, and ultimately drive revenue growth across various sectors, from tech startups to established enterprises.
Businesses can tailor their sales scorecards by aligning key performance indicators (KPIs) with specific organizational goals and objectives. This involves identifying the most critical metrics for success, whether it's increasing revenue, expanding market share, or improving customer retention, and then structuring the scorecard to track progress towards those goals. For example, a retail company focused on customer acquisition might prioritize KPIs like lead generation, conversion rates, and customer lifetime value, while a SaaS company might emphasize metrics like monthly recurring revenue, customer churn, and upsell/cross-sell rates. Ultimately, this tailored approach enables businesses to monitor performance against strategic priorities and make data-driven decisions to optimize sales efforts.
A sales scorecard can be effectively built and managed using a variety of tools and software, including Customer Relationship Management (CRM) systems, business intelligence (BI) platforms, and dedicated sales performance management (SPM) solutions. These technologies streamline data collection, analysis, and visualization, enabling sales teams to track key metrics, identify areas for improvement, and ultimately optimize performance. For instance, many CRMs like Salesforce and HubSpot offer built-in scorecard functionalities, while specialized SPM tools like SalesLoft and Gong provide more granular insights and reporting capabilities, ultimately empowering organizations to make data-driven decisions and drive revenue growth.
Sales scorecards should be updated regularly, ideally on a monthly basis, to accurately reflect evolving market conditions and sales performance. This frequent review enables sales teams to identify trends, adjust strategies, and capitalize on emerging opportunities, ultimately driving revenue growth and competitive advantage. Many successful organizations find that monthly updates, coupled with quarterly in-depth analyses, provide a dynamic and responsive approach to sales performance management.
Data visualization plays a crucial role in enhancing the usability of a sales scorecard by transforming raw data into easily digestible and actionable insights. Charts, graphs, and dashboards present key performance indicators (KPIs) in a clear and concise manner, enabling sales teams to quickly identify trends, track progress, and pinpoint areas for improvement. For example, a visual representation of sales conversion rates can highlight which products or customer segments are performing well, while a pipeline visualization can demonstrate deal flow and potential revenue. Ultimately, data visualization empowers sales teams to make informed decisions and drive better results.
Sales scorecards can pinpoint underperforming team members or processes by tracking key metrics like conversion rates, deal sizes, and customer satisfaction scores. By analyzing these metrics across individuals and departments, businesses can identify areas where improvement is needed, whether it's through targeted coaching for specific team members or process optimization within sales workflows. This data-driven approach enables organizations to address weaknesses proactively, ultimately boosting overall sales performance and revenue generation.
Integrating qualitative feedback with quantitative metrics in a sales scorecard presents both challenges and opportunities. It enables a more holistic view of sales performance by capturing not just numbers, but also customer sentiment, deal complexities, and individual rep strengths. This approach delivers deeper insights into sales processes, allowing organizations to identify areas for improvement, personalize coaching, and ultimately drive higher customer satisfaction and revenue growth.
Effective communication of sales scorecards across teams involves clearly outlining key performance indicators (KPIs), their definitions, and how they contribute to overall company goals. Companies can utilize dashboards and reporting tools that provide real-time visibility into performance, allowing for transparent tracking and progress monitoring. This fosters collaboration and alignment, with sales, marketing, and operations teams understanding individual and collective contributions to revenue targets, ultimately driving improved performance and a shared sense of accountability.
Encouraging sales teams to actively engage with their scorecards involves strategies that make them relevant, personalized, and actionable. Sales leaders can implement gamification elements, like leaderboards and rewards, to foster healthy competition and motivation. Furthermore, regular coaching sessions focused on scorecard data analysis can help reps understand their performance, identify areas for improvement, and set achievable goals. These approaches ultimately lead to increased sales performance and a more data-driven sales culture.
Historical sales data can be leveraged to refine key performance indicators (KPIs), identify sales patterns, and personalize customer engagement strategies. By analyzing past sales trends, organizations can pinpoint successful sales approaches, target high-performing customer segments, and optimize resource allocation for maximum impact. This data-driven approach empowers sales teams to make informed decisions, ultimately driving revenue growth and exceeding sales targets.
A well-designed sales scorecard tracks key performance indicators (KPIs) to monitor sales progress and identify areas for improvement. However, common mistakes include focusing solely on vanity metrics like revenue without considering factors like deal size or customer lifetime value, neglecting to align KPIs with overall business goals, and failing to establish clear, measurable targets. By avoiding these pitfalls and incorporating specific metrics relevant to your sales strategy, you can create a scorecard that effectively drives sales performance and provides valuable insights for continuous improvement.
Sales scorecards contribute to employee motivation and accountability by clearly defining performance expectations and tracking progress toward goals. These visual representations of key metrics, like deal closure rates and customer satisfaction, provide employees with real-time insights into their performance, allowing them to identify strengths and areas for improvement. By linking individual performance to team and company objectives, sales scorecards foster a sense of shared purpose and collective achievement, ultimately driving higher engagement and productivity.
Sales scorecards can balance comprehensive data with simplicity by focusing on key performance indicators (KPIs) that directly impact revenue and efficiency. These KPIs, such as conversion rates, deal size, and customer lifetime value, provide a clear picture of sales performance without overwhelming teams with unnecessary metrics. Organizations in various sectors, including financial services and technology, find success by streamlining their scorecards to highlight these crucial metrics, enabling data-driven decision-making and ultimately driving sales growth.
A comprehensive sales scorecard should consider KPIs tailored to each sector's unique needs, including customer acquisition cost (CAC) for SaaS companies, average deal size for enterprise software, and conversion rate for e-commerce businesses. These KPIs, when tracked and analyzed, provide valuable insights into sales performance, enabling organizations to identify strengths, weaknesses, and areas for improvement, ultimately driving revenue growth and market share expansion.
Sales scorecards provide organizations with a clear, data-driven view of sales performance by tracking key metrics like conversion rates, lead generation, and deal closure. These scorecards enable strategic forecasting and planning by identifying trends, pinpointing areas for improvement, and providing insights into sales team effectiveness. Through analyzing historical data and current performance, organizations can make informed decisions regarding resource allocation, pipeline management, and sales strategy adjustments, ultimately driving revenue growth and market share expansion.
-
Editable templates with innovative design and color combination.
-
Out of the box and creative design.
-
Great experience, I would definitely use your services further.