


Sales Turnover Report With Revenue And Customer Churn Analytics




Try Before you Buy Download Free Sample Product
 Impress Your
 Audience
 100%
100% Editable
 Save Hours
 of Time


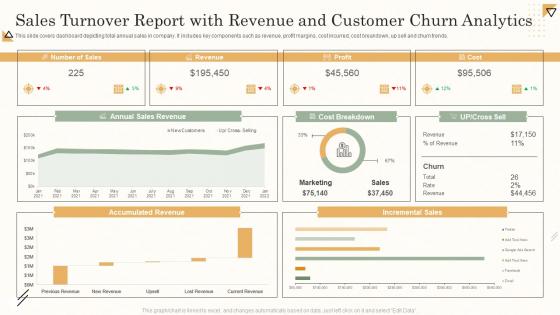
This slide covers dashboard depicting total annual sales in company. It includes key components such as revenue, profit margins, cost incurred, cost breakdown, up sell and churn trends.
People who downloaded this PowerPoint presentation also viewed the following :
Sales Turnover Report With Revenue And Customer Churn Analytics with all 7 slides:
Use our Sales Turnover Report With Revenue And Customer Churn Analytics to effectively help you save your valuable time. They are readymade to fit into any presentation structure.






FAQs for Sales Turnover Report With Revenue And
Key sales metrics include conversion rates, average deal size, sales cycle length, pipeline velocity, customer acquisition cost, and lead-to-close ratios. These analytics enable organizations to identify bottlenecks, optimize resource allocation, and enhance forecasting accuracy, with many companies finding that tracking these metrics simultaneously delivers improved sales performance and strategic competitive advantage.
Sales analytics helps identify target customer segments by analyzing purchasing patterns, demographic data, behavioral trends, buying frequency, and revenue potential across different customer groups. Through advanced segmentation algorithms and predictive modeling, organizations can pinpoint high-value prospects, optimize marketing campaigns, and tailor sales strategies to specific segments, ultimately delivering improved conversion rates and increased revenue per customer acquisition.
Predictive analytics enables organizations to forecast sales trends by analyzing historical data, market patterns, customer behavior, and seasonal fluctuations to identify future opportunities and challenges. Through machine learning algorithms, businesses streamline inventory management, optimize pricing strategies, and enhance resource allocation, with many retail and manufacturing companies finding that predictive insights ultimately deliver improved revenue forecasting and competitive advantage.
Sales teams can leverage data visualization through interactive dashboards, trend charts, pipeline funnel graphics, heat maps, and performance scorecards to transform complex sales data into actionable insights. These visual tools enable managers to quickly identify bottlenecks, track quota attainment, and spot emerging opportunities across territories, ultimately delivering faster decision-making and improved sales outcomes.
Common pitfalls include focusing on vanity metrics over actionable insights, ignoring seasonal trends and external factors, drawing conclusions from insufficient sample sizes, and failing to segment data appropriately. Many organizations find that overlooking data quality issues, correlation versus causation errors, and cherry-picking favorable statistics ultimately undermines strategic decision-making and competitive advantage.
Sales analytics informs product development and inventory management by identifying top-performing products, customer preferences, seasonal trends, and demand patterns through comprehensive data analysis. This intelligence enables companies to optimize inventory levels, reduce carrying costs, and develop products that align with market demand, with retailers and manufacturers finding significantly improved stock turnover and reduced waste.
Effective sales analytics tools include Salesforce Analytics, HubSpot, Tableau, Microsoft Power BI, and Google Analytics, along with CRM-integrated platforms like Pipedrive and Zoho. These technologies streamline data collection, automate reporting, and deliver actionable insights through real-time dashboards, with many organizations finding that strategic combinations ultimately enhance forecasting accuracy and accelerate sales cycle optimization.
Integrating sales analytics with CRM systems enhances customer relationship management by providing deeper insights into customer behavior, predicting buying patterns, and personalizing engagement strategies. This strategic combination enables sales teams to identify high-value prospects, optimize outreach timing, and deliver targeted solutions, ultimately improving conversion rates and customer retention across industries.
Descriptive analytics reveals what happened in past sales performance, diagnostic analytics explains why specific outcomes occurred, predictive analytics forecasts future sales trends and opportunities, and prescriptive analytics recommends optimal actions to achieve targets. These progressive analytics layers enable sales teams to move from historical reporting to strategic decision-making, with organizations increasingly combining all four approaches for competitive advantage.
Sales analytics enhances lead generation and conversion strategies by identifying high-value prospects, optimizing campaign performance, and predicting conversion likelihood through data-driven insights. Through advanced tracking and behavioral analysis, organizations can streamline their sales funnels, personalize outreach efforts, and allocate resources more effectively, ultimately delivering higher conversion rates and improved ROI.
Companies can evaluate sales initiative ROI through conversion rate analysis, customer acquisition cost tracking, sales cycle measurement, pipeline velocity assessment, and lifetime value calculations. These analytics methods enable organizations to identify high-performing campaigns, optimize resource allocation, and demonstrate measurable impact, with many businesses finding that data-driven evaluation ultimately delivers improved forecasting accuracy and strategic competitive advantage.
Real-time sales analytics influences decision-making by providing immediate insights into customer behavior, inventory levels, and market trends, enabling rapid responses to opportunities and challenges. In fast-paced sectors like retail and e-commerce, managers can adjust pricing strategies, reallocate resources, and optimize campaigns instantly, ultimately delivering competitive advantage and improved revenue outcomes.
Sales analytics enhances cross-departmental collaboration by providing unified data visibility, standardized performance metrics, shared customer insights, and real-time reporting dashboards that break down information silos. Through integrated analytics platforms, marketing, finance, operations, and customer service teams can align strategies, coordinate campaigns, and optimize resource allocation, while ultimately delivering consistent customer experiences and accelerated revenue growth across the entire organization.
Historical sales data enables strategic planning by identifying seasonal trends, customer behavior patterns, product performance cycles, and market fluctuations that inform forecasting models. Through predictive analytics, organizations can optimize inventory management, refine pricing strategies, and target high-value customer segments more effectively, while many companies finding that data-driven approaches deliver significantly improved conversion rates and revenue growth.
Ethical sales data practices include obtaining proper customer consent, ensuring data accuracy, maintaining transparent collection methods, protecting personally identifiable information, and establishing clear retention policies. While these considerations present compliance challenges, they ultimately enhance customer trust and competitive advantage, with many organizations finding that ethical data practices streamline operations and deliver stronger long-term relationships.
-
I loved the hassle-free signup process. A few minutes and, I had this giant collection of beautiful designs.
-
I was confident and well prepared for my presentation for the first time ever. With SlideTeam’s templates, I could deliver one of my best presentations. Will be coming back for more!