


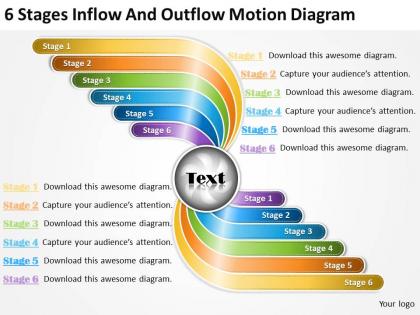
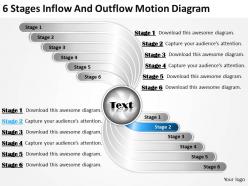
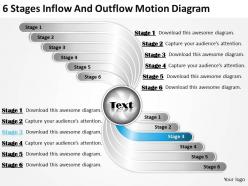
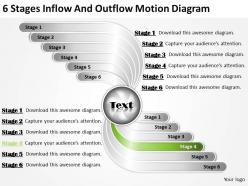
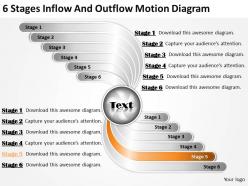
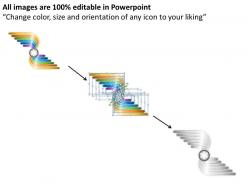
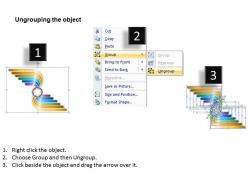
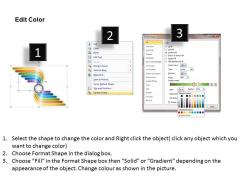
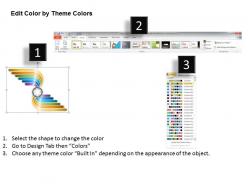
Strategy 6 stages inflow and outflow motion diagram powerpoint templates ppt backgrounds for slides




Try Before you Buy Download Free Sample Product
 Impress Your
 Audience
 100%
100% Editable
 Save Hours
 of Time


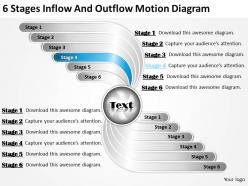
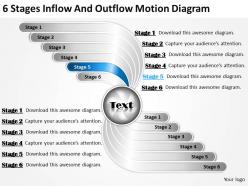
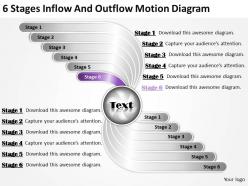
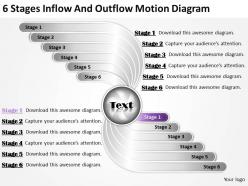
Construct your premises on our Strategy 6 Stages Inflow And Outflow Motion Diagram Powerpoint Templates PPT Backgrounds For Slides. They will create a sturdy structure.
People who downloaded this PowerPoint presentation also viewed the following :
Strategy 6 stages inflow and outflow motion diagram powerpoint templates ppt backgrounds for slides with all 18 slides:
Our Strategy 6 Stages Inflow And Outflow Motion Diagram Powerpoint Templates PPT Backgrounds For Slides collection have been developed to suit the discriminating tastes of today's business people. We invite you to browse our exceptional collection.



FAQs for Strategy 6 stages inflow and outflow motion diagram powerpoint templates ppt
Key components include strategic inputs (market data, competitive intelligence, stakeholder feedback), core processes (analysis, decision-making, resource allocation), and outputs (action plans, performance metrics, resource deployment). These elements work together by creating transparent workflows, enabling systematic strategy development, and tracking resource utilization across departments, ultimately delivering measurable outcomes and strategic alignment for organizations seeking competitive advantage.
A strategy inflow-outflow diagram enhances organizational decision-making by visualizing resource flows, identifying bottlenecks, and revealing interdependencies between departments, processes, and strategic initiatives. This approach enables leaders to optimize resource allocation, streamline operations, and anticipate downstream impacts, with many organizations finding that clear visual mapping reduces decision time, minimizes resource conflicts, and ultimately delivers more coordinated strategic execution.
Data visualization transforms inflow-outflow diagrams from simple charts into powerful strategic tools by enhancing clarity, enabling pattern recognition, and facilitating real-time decision-making. Through interactive dashboards and dynamic visual elements, organizations can streamline complex financial flows, operational processes, and resource allocation patterns, with many finding that enhanced visualization ultimately delivers faster insights and improved strategic planning across departments.
Organizations can tailor their inflow-outflow diagrams by aligning resource flows with specific objectives, incorporating goal-relevant metrics, customizing input-output categories, and establishing performance benchmarks that reflect strategic priorities. This strategic customization enables companies across sectors like manufacturing and financial services to optimize resource allocation, enhance operational efficiency, and track progress toward competitive advantages, ultimately delivering measurable outcomes and accelerated goal achievement.
Common pitfalls include oversimplifying complex interdependencies, failing to validate data accuracy, neglecting stakeholder input during creation, and creating static diagrams that aren't regularly updated. Organizations often overlook bottlenecks, ignore feedback loops between processes, and focus too heavily on current state rather than desired outcomes, with many finding that involving cross-functional teams early prevents costly revisions and enhances strategic alignment.
Stakeholders can be effectively engaged through collaborative workshops, structured interviews, cross-functional mapping sessions, and iterative feedback cycles that capture their unique perspectives on resource flows. By involving department heads, operational teams, and external partners in diagram development, organizations enhance accuracy, build buy-in, and ensure comprehensive representation of all critical inflows and outflows.
Technology enhances strategy inflow-outflow diagrams through automated data integration, real-time visualization tools, collaborative platforms, AI-powered pattern recognition, and interactive dashboards that streamline complex information flows. These digital solutions enable organizations to create dynamic, data-driven diagrams with greater accuracy and speed, while facilitating cross-functional collaboration and delivering deeper strategic insights for competitive advantage.
Inflow-outflow diagrams emphasize dynamic resource movement and interconnected systems, while traditional strategic planning tools focus on static goals, linear timelines, and hierarchical structures. These visual frameworks enable organizations to identify bottlenecks, optimize resource allocation, and anticipate cascading effects across departments, with many companies finding that this systems approach delivers more agile decision-making than conventional planning methods.
Indicators prompting strategy inflow-outflow diagram revisions include significant market shifts, competitive disruptions, resource availability changes, performance metric deviations, and stakeholder feedback patterns. These signals enable organizations to recalibrate their strategic resource allocation, with many finding that regular assessment of customer demand fluctuations, operational bottlenecks, and revenue stream variations ultimately delivers more agile strategic positioning.
Organizations measure strategy success through inflow-outflow diagrams by tracking key performance indicators, resource allocation efficiency, workflow bottlenecks, conversion rates, and outcome delivery across different strategic initiatives. These visual frameworks enable businesses to identify underperforming areas, optimize resource distribution, and enhance operational effectiveness, with many finding that regular diagram analysis delivers improved decision-making and sustainable competitive advantage.
Inflow-outflow diagrams are most beneficial for strategic planning in resource allocation, process optimization, financial forecasting, supply chain management, and organizational restructuring contexts. These visual tools streamline decision-making by mapping dependencies, identifying bottlenecks, and predicting outcomes, with many organizations finding that clear flow visualization enhances strategic alignment and operational efficiency across departments.
A strategy inflow-outflow diagram facilitates cross-departmental collaboration by visualizing resource dependencies, information exchanges, and workflow connections between teams, creating transparency around how departments impact each other's operations. This shared visual framework enables marketing, operations, finance, and other departments to identify bottlenecks, align priorities, and coordinate initiatives more effectively, ultimately delivering improved project outcomes and organizational efficiency.
Companies like Amazon, Toyota, and Netflix have successfully integrated inflow-outflow diagrams into strategic planning, mapping resource flows, customer acquisition channels, and operational processes. These organizations streamline decision-making by visualizing cash flows, talent pipelines, and market dynamics, with many finding that such strategic mapping enhances resource allocation, minimizes operational bottlenecks, and ultimately delivers competitive advantage through data-driven insights.
Stakeholder feedback significantly shapes strategy inflow-outflow diagrams by identifying critical resource flows, operational bottlenecks, and strategic priorities that might otherwise be overlooked in initial mapping. Through collaborative input sessions, organizations can validate assumptions, uncover hidden dependencies, and ensure comprehensive coverage of all value streams, with many finding that stakeholder insights ultimately enhance diagram accuracy and organizational buy-in for strategic implementation.
When presenting inflow-outflow diagrams to executives, focus on strategic implications rather than technical details, use clear visual hierarchies with consistent color coding, and emphasize key performance metrics that directly impact business outcomes. Start with high-level insights, provide context for significant variances, and conclude with actionable recommendations, ensuring the presentation drives decision-making rather than simply displaying data.
-
It saves your time and decrease your efforts in half.
-
Good research work and creative work done on every template.