


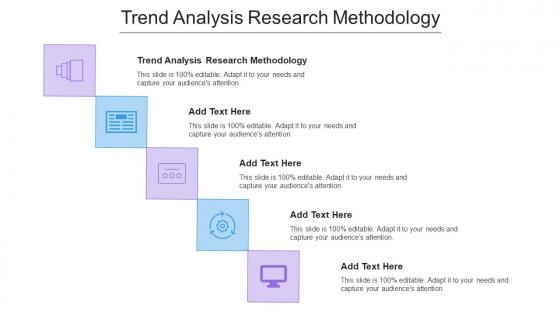
Trend Analysis Research Methodology Ppt Powerpoint Presentation Model Cpb



Try Before you Buy Download Free Sample Product
 Impress Your
 Audience
 100%
100% Editable
 Save Hours
 of Time


Our Trend Analysis Research Methodology Ppt Powerpoint Presentation Model Cpb are topically designed to provide an attractive backdrop to any subject. Use them to look like a presentation pro.
People who downloaded this PowerPoint presentation also viewed the following :
Trend Analysis Research Methodology Ppt Powerpoint Presentation Model Cpb with all 6 slides:
Use our Trend Analysis Research Methodology Ppt Powerpoint Presentation Model Cpb to effectively help you save your valuable time. They are readymade to fit into any presentation structure.





FAQs for Trend Analysis Research Methodology Ppt Powerpoint
Ok so first figure out what you're actually trying to answer, then hunt down good data sources. You'll need like 3-5 years of historical stuff if you can swing it. Cleaning the data is honestly such a pain but don't skip it - I learned that the hard way. Look for weird patterns or cycles while you're at it. After that, run some stats or make charts to spot the trends. The whole "garbage in, garbage out" thing is so real here. Finally, write up what you found and what it actually means. Oh and document everything because you'll definitely forget your process later.
Honestly, turning your data into charts and graphs is such a lifesaver when you're drowning in spreadsheets. Your brain just picks up on visual patterns way faster than scanning through endless rows of numbers. Line graphs are perfect for spotting trends over time - I always start there. Heat maps and bar charts help you catch weird outliers or cyclical stuff you'd totally miss otherwise. And when you have to present to your boss or whoever, a good visual basically tells the whole story for you. Way better than making people squint at tables of data.
Honestly, it depends on what you're trying to do and how much you wanna spend. Excel or Google Sheets work great for basic tracking - like, why overcomplicate things? Tableau's where it's at if you need fancy visualizations (seriously, that software makes even boring data look incredible). Power BI's solid too. The data science people I know swear by R and Python, though that's probably overkill for most situations. SPSS is still around for traditional research stuff. Oh, and don't forget - sometimes the fancier your charts look, the more impressed stakeholders get. Weird but true.
Honestly, I'd start with the big picture - look at 2+ years of data to figure out what's actually normal for your business. Then overlay shorter windows like 3-6 months to catch recent trends. The thing is, if you only look at 30 days, every little blip seems huge when it's probably just regular fluctuation. I learned this the hard way lol. Short-term data is super noisy, but zoom out and you'll spot the real structural changes. Once you know your baseline patterns, you can layer in those shorter timeframes to see what's actually shifting vs what's just temporary weirdness.
Look, historical data is your best friend for spotting what's coming next. I always start by plotting everything visually first - honestly, you'll catch patterns that totally disappear in spreadsheets. Watch for seasonal stuff and how outside events mess with your numbers. The sweet spot is usually 2-3 full cycles of whatever you're tracking. Don't go back too far though - if market conditions were completely different, that old data just adds noise. Too little history and you miss the bigger picture. It's kinda like trying to predict the weather with just yesterday's forecast, you know?
Numbers tell you what's happening, but qualitative research explains the why behind it all. Think interviews, focus groups - that stuff reveals the actual human motivations driving your trends. Honestly, most people get way too hung up on data points and completely miss the bigger story. Like, your analytics might show a spike, but only talking to real people tells you if it'll last or just fizzle out. Plus you'll catch emerging behaviors that don't show up in your dashboards yet. I'd start by figuring out which trend questions your data can't actually answer on its own.
Honestly, engagement velocity is where it's at - like how fast those likes and shares are climbing. Raw volume doesn't tell you much, but a 300%+ spike in mentions over 24 hours? That's when you know something's happening. I always track hashtag frequency jumps and how sentiment changes too. Cross-platform stuff matters since trends usually bounce around before they blow up everywhere. Oh, and set alerts for percentage changes instead of just numbers - trust me, you'll thank me later when you're not glued to your screen all day checking manually.
Dude, economic shifts will totally throw off your trend analysis if you're not watching for them. Consumer behavior goes crazy when the economy changes - that upward trend might just be panic buying, you know? I learned this the hard way last year. You've got to look at interest rates, unemployment, inflation stuff alongside your business data. Otherwise you're missing half the story. What seems like solid growth could actually be people hoarding before a recession hits. Always check what's happening with the broader economy before you make any big strategic moves. Trust me on this one.
Data privacy is huge here - don't touch personal info without clear permission or you'll risk legal issues. Trend analysis sounds harmless but your findings could actually impact real people's decisions and lives. I always forget this part honestly, but document your methodology upfront and note any limitations. Be transparent about what you can't account for. Oh and definitely have someone else review your approach before you get too deep into it - sometimes you need fresh eyes to catch blind spots you've missed.
Look at customer behavior patterns and industry data regularly - that's where you'll catch shifts early. Social media is gold for this stuff, honestly way better than most people realize. I'd set up monthly trend reviews with your team and create some basic criteria for what actually matters vs random noise. Multiple data sources beat single ones every time. Pick one promising trend and run a small test project with it. The whole point is beating competitors to the punch on product development. Don't overthink it though - start somewhere and adjust as you go.
Honestly, the biggest trap is cherry-picking data that backs up what you already think. Don't confuse correlation with causation either - that's like statistics 101 but people mess it up constantly. Three data points isn't a trend, it's basically nothing. You need way more time to see real patterns. Oh, and seasonal stuff will totally throw you off if you're not careful. External factors matter too - there's always something else going on that could explain your results. Try to cross-check with other data sources when you can. Best advice? Question your own work before anyone else does.
Dude, you absolutely need to segment your market before looking at trends - trust me on this one. Here's the thing: what looks like growth overall might just be one customer group going crazy while others completely crash. I learned this the hard way last year. Break your data down by age, location, buying habits, whatever makes sense for your business. You'll spot patterns that disappear when everything's lumped together. Those "average customer" insights? They're usually garbage because they don't match any real person. Pick 3-4 segments that actually matter to your goals and analyze each separately.
Charts and graphs are your best friend here - they make trends way easier to digest than walls of numbers. Tell a story with your data instead of just throwing it at people. Honestly, I've watched so many presentations where someone drones on about statistical methods while the executives are thinking "just tell me what this means for my budget." Keep it simple and focus on 2-3 big insights max. Skip the methodology rabbit holes. Always tie your findings back to actual business decisions they need to make. Oh, and end with concrete next steps - something they can actually do with what you've told them.
Honestly, the best way is testing your analysis on data you haven't touched yet - like a holdout sample. Cross-validation works great too. You'll want to backtest against past periods and maybe triangulate with different data sources to double-check things. Statistical stuff like R-squared or MAPE can tell you how accurate you're being. Oh, and definitely compare your results to what experts in your field are predicting - that's huge. The real test though? Track how your predictions actually pan out over time against what really happens.
It really comes down to timing and what you're actually measuring. Healthcare moves slow - you're tracking patient outcomes across years, maybe demographic shifts. Finance is the opposite, everything's real-time and trends flip constantly. Tech though? That's honestly chaos - something can blow up and be dead in like 3 months. The compliance stuff varies too, which affects how you can even gather data. I'd figure out how long trends typically last in your sector first. That'll basically dictate your whole approach.
-
Extremely professional slides with attractive designs. I especially appreciate how easily they can be modified and come in different colors, shapes, and sizes!
-
Perfect template with attractive color combination.