


Waste bin kpi dashboard treating developing and management of new ways ppt brochure




Try Before you Buy Download Free Sample Product
 Impress Your
 Audience
 100%
100% Editable
 Save Hours
 of Time


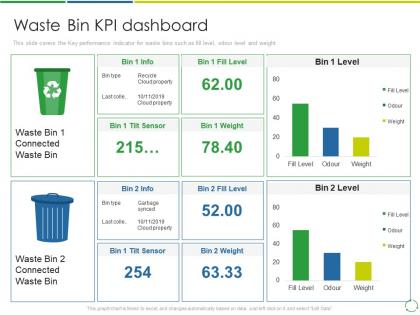
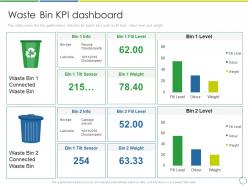
This slide covers the Key performance indicator for waste bins such as fill level, odour level and weight.
People who downloaded this PowerPoint presentation also viewed the following :
Waste bin kpi dashboard treating developing and management of new ways ppt brochure with all 2 slides:
Use our Waste Bin KPI Dashboard Treating Developing And Management Of New Ways Ppt Brochure to effectively help you save your valuable time. They are readymade to fit into any presentation structure.
FAQs for Waste bin kpi dashboard treating developing and management of new
Waste bin KPI dashboards should include collection frequency metrics, fill level monitoring, route optimization efficiency, maintenance costs per bin, and waste diversion rates by material type. These indicators enable municipalities and waste management companies to streamline operations, reduce collection costs, and enhance service reliability, with many organizations finding that real-time monitoring ultimately delivers significant operational savings.
Real-time data collection enhances waste management efficiency by enabling dynamic route optimization, predictive maintenance scheduling, and automated capacity monitoring across collection networks. Through IoT sensors and smart bin technologies, municipalities and waste management companies streamline operations, reduce fuel costs, and minimize overflow incidents, while delivering faster services and ultimately achieving 20-30% operational cost reductions.
Effective waste bin KPI dashboard visualizations include heat maps for bin capacity distribution, gauge charts for fill levels, trend lines for collection frequency patterns, geographic maps for route optimization, and bar charts comparing performance across locations. These visualizations enable facility managers and waste management companies to streamline collection schedules, minimize overflow incidents, and reduce operational costs, ultimately delivering enhanced service efficiency and environmental compliance.
Historical data trends enhance waste disposal understanding by revealing consumption patterns, seasonal variations, disposal frequency fluctuations, and resource allocation inefficiencies across different periods and locations. Through comprehensive analytics dashboards, organizations can identify peak waste generation times, optimize collection schedules, and reduce operational costs, while municipalities increasingly leverage these insights to streamline services and improve environmental sustainability outcomes.
User engagement drives waste bin KPI dashboard effectiveness by ensuring consistent data interaction, promoting accountability among waste management teams, and facilitating data-driven decision making across operations. When facility managers, sustainability coordinators, and operational staff actively utilize these dashboards, organizations achieve improved waste reduction targets, enhanced recycling compliance, and streamlined resource allocation, ultimately delivering measurable environmental impact and cost savings.
Waste bin fill levels can be accurately monitored through IoT sensors, ultrasonic measurement devices, weight-based systems, GPS tracking, and real-time data analytics platforms. These technologies streamline waste management by providing precise fill percentages, optimizing collection routes, and reducing operational costs, with many municipalities and facility managers finding that automated monitoring delivers significantly improved efficiency and resource allocation.
Best practices for setting waste management KPI benchmarks include analyzing historical performance data, researching industry standards, conducting competitor analysis, establishing baseline measurements, and setting SMART goals with realistic timelines. These benchmarks enable organizations to track recycling rates, waste diversion percentages, and cost per ton effectively, with many municipalities and corporations finding that data-driven targets ultimately deliver measurable environmental impact and operational cost reductions.
IoT technology enhances waste bin monitoring by enabling real-time fill level tracking, predictive maintenance alerts, and automated collection scheduling through connected sensors and data analytics. These smart systems streamline waste management operations by reducing unnecessary pickups, optimizing route planning, and minimizing overflow incidents, ultimately delivering operational cost savings and improved urban cleanliness standards.
Organizations face challenges including data collection inconsistencies, sensor integration complexities, staff resistance to new monitoring systems, initial setup costs, and ensuring accurate real-time tracking across multiple locations. While these implementation hurdles require strategic planning and resource allocation, many facilities find that comprehensive training, phased rollouts, and clear communication about efficiency benefits help overcome resistance, ultimately delivering improved waste management visibility and operational cost reductions.
KPI dashboards enable facility managers to promote sustainability initiatives by tracking waste diversion rates, energy consumption patterns, carbon footprint metrics, and resource utilization efficiency across their operations. Through real-time monitoring, managers can identify improvement opportunities, benchmark performance against sustainability goals, and demonstrate measurable environmental impact to stakeholders, ultimately driving cost savings while enhancing corporate responsibility.
Regular KPI reporting significantly accelerates waste reduction efforts by providing continuous visibility into performance trends, identifying inefficiencies quickly, and enabling data-driven corrective actions. Through consistent monitoring, organizations streamline resource allocation, enhance operational accountability, and maintain momentum toward sustainability goals, with many facilities finding that weekly reporting cycles deliver measurably faster waste reduction outcomes.
Predictive analytics enhances waste management KPIs by forecasting collection schedules, predicting bin fill rates, and optimizing route efficiency through historical data analysis. These technologies enable municipalities and waste companies to reduce operational costs, minimize overflow incidents, and improve service reliability, with many organizations finding that predictive models deliver 20-30% efficiency gains.
Essential recycling performance metrics include contamination rates, diversion rates, material recovery percentages, cost per ton processed, and compliance with environmental regulations. These indicators enable waste management organizations to optimize sorting processes, reduce operational costs, and enhance sustainability outcomes, with many municipalities and corporations finding that comprehensive tracking ultimately delivers improved environmental impact and operational efficiency.
A waste bin KPI dashboard influences public awareness by displaying real-time fill levels, collection frequencies, recycling rates, contamination data, and cost metrics in accessible formats. These transparent visualizations enable communities to understand their environmental impact, track progress toward sustainability goals, and identify improvement opportunities, ultimately fostering greater civic engagement and responsible waste disposal behaviors across neighborhoods.
Companies can customize compliance dashboards by configuring automated alerts for regulatory thresholds, integrating real-time monitoring systems, incorporating industry-specific metrics, and establishing audit trail capabilities. Through customizable widgets and reporting modules, organizations in healthcare, manufacturing, and municipal services streamline regulatory reporting, minimize compliance risks, and ensure consistent documentation, ultimately delivering faster audit responses and reduced regulatory penalties.
-
Very well designed and informative templates.
-
Use of different colors is good. It's simple and attractive.
-
Professional and unique presentations.
-
Use of icon with content is very relateable, informative and appealing.