


Workforce Optimum Utilization Planning Powerpoint Presentation Slides


Try Before you Buy Download Free Sample Product
 Impress Your
 Audience
Editable
of Time


Create stunning presentations by employing Workforce Optimum Utilization Planning PowerPoint Presentation Slides. Showcase the projects that the firm currently undertakes. Demonstrate the need for resource optimization by taking the assistance of staff utilization PPT themes. Present the concerns that are affecting the business’s working with the help of our PPT slide deck. Utilize our professionally designed employee utilization PowerPoint slideshow to perform the competitive analysis. You can examine the current scenario of the firm by incorporating an engaging PPT slide deck. It is easy to present the information about workforce distribution, skill level analysis by the department, current workforce capacity evaluation, etc. Showcase the types of training that the employees require with the help of a visually appealing PPT slideshow. Present the team analysis based on experience and utilization rate. Take the assistance of our modern designed presentation to analyze employee efficiency and utilization rate effectively.
People who downloaded this PowerPoint presentation also viewed the following :
Content of this Powerpoint Presentation
Slide 1: This tile slide introduces Workforce Optimum Utilization Planning. Add the name of your company here.
Slide 2: This slide contains the Table of Contents. It includes - Future Scenario, Current Scenario, Overview, etc.
Slide 3: This is a table of content slide showing the Overview.
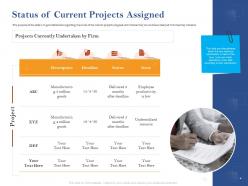
Slide 4: This slide presents the Status of Current Projects Assigned.
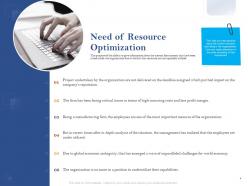
Slide 5: This slide presents the Need of Resource Optimization.
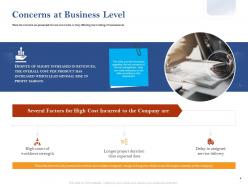
Slide 6: This slide presents the Concerns at Business Level.
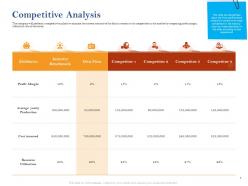
Slide 7: This slide presents the Competitive Analysis.
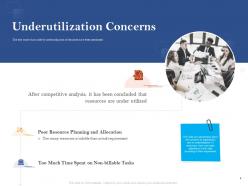
Slide 8: This slide presents the Underutilization Concerns.
Slide 9: This is a table of content slide showing the Current Scenario.
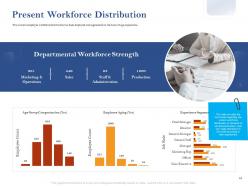
Slide 10: This slide presents the Present Workforce Distribution.
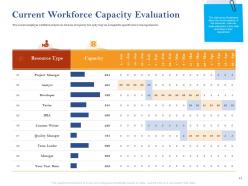
Slide 11: This slide presents the Current Workforce Capacity Evaluation.
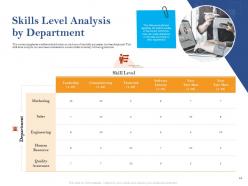
Slide 12: This slide presents the Skill Level Department Skills Level Analysis by Department.
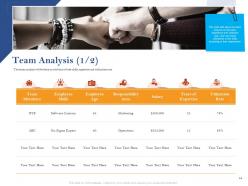
Slide 13: This slide presents the Team Analysis (1/2). The team analysis will be done on the basis of their skills, expertise, and utilization rate.
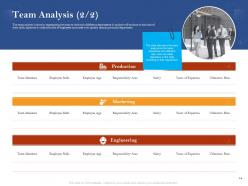
Slide 14: This slide presents the Team Analysis (2/2). The team analysis is done by segregating the team on the basis of different departments & analysis will be done on the basis of their skills, expertise & utilization rate of employees associated with a specific team in a particular department.
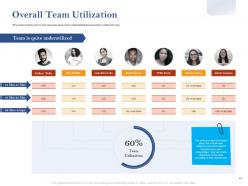
Slide 15: This slide presents the Overall Team Utilization.
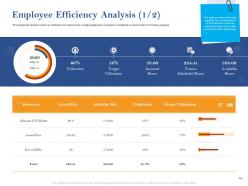
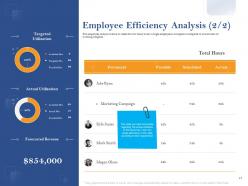
Slide 16: This slide presents the Employee Efficiency Analysis (1/2). The employee analysis is done to check for how many hours a single employee is occupied as compared to actual hours of working assigned.
Slide 17: This slide presents the Employee Efficiency Analysis (2/2). It provides information regarding the actual utilization of the resources.
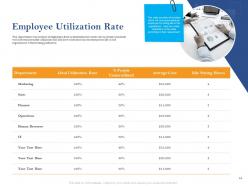
Slide 18: This slide presents the Employee Utilization Rate.
Slide 19: This is a table of content slide showing the Future Scenario.
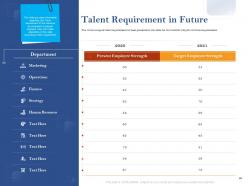
Slide 20: This slide presents the Talent Requirement in Future.
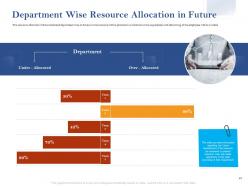
Slide 21: This slide presents the Department Wise Resource Allocation in Future.
Slide 22: This is a table of content slide showing the Action Plan – Training.
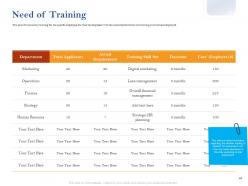
Slide 23: This slide presents the Need of Training.
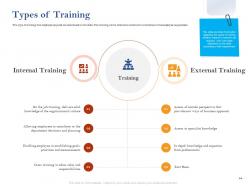
Slide 24: This slide presents the Types of Training.
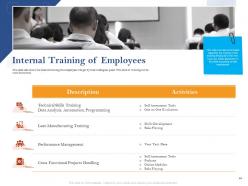
Slide 25: This slide presents the Internal Training of Employees.
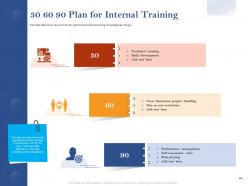
Slide 26: This slide presents the 30 60 90 Plan for Internal Training.
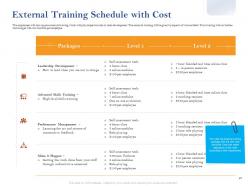
Slide 27: This slide presents the External Training Schedule with Cost.
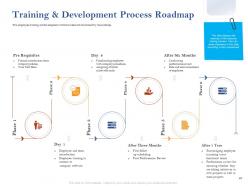
Slide 28: This slide presents the Training & Development Process Roadmap.
Slide 29: This is a table of content slide showing the Overall Impact Analysis.
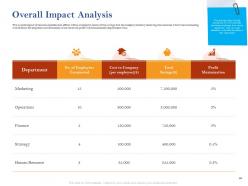
Slide 30: This slide presents the Overall Impact Analysis. The overall impact of resource optimization efforts will be analyzed in terms of the savings that the company made by removing the resources.
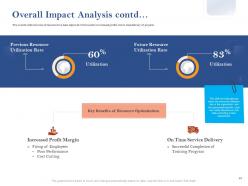
Slide 31: This slide presents the Overall Impact Analysis. (contd…) – It provides a glimpse of the improved utilization rate in the organization and the associated benefits.
Slide 32: This is the Workforce Optimum Utilization Planning - Icons Slide.
Slide 33: This slide presents the Additional Slides.
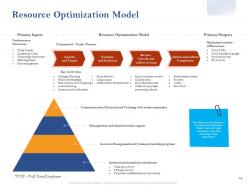
Slide 34: This slide presents the Resource Optimization Model.
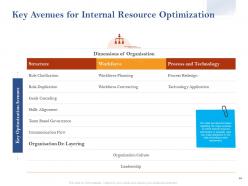
Slide 35: This slide presents the Key Avenues for Internal Resource Optimization.
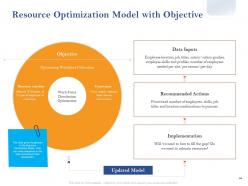
Slide 36: This slide presents the Resource Optimization Model with Objective.
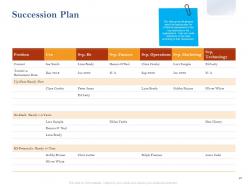
Slide 37: This slide presents the Succession Plan.
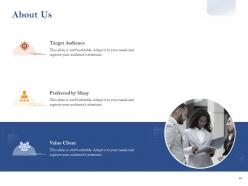
Slide 38: This slide contains the information about the company aka the ‘About Us’ section. This includes the Value Clients, the Target Audience, and Preferred by Many.
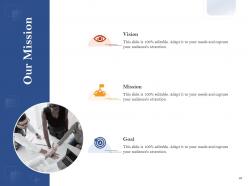
Slide 39: This slide provides the Mission for the entire company. This includes the vision, the mission, and the goal.
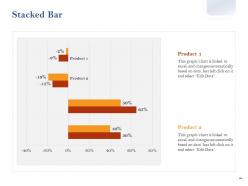
Slide 40: This slide shows a Stacked Bar that compares 2 products’ data.
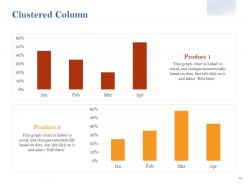
Slide 41: This slide shows a Clustered Column that compares 2 products’ data over a timeline of months.
Slide 42: This slide presents the Puzzle.
Slide 43: This is the Lego slide. In this slide, you can showcase the building blocks of your project or concept.
Slide 44: This slide presents the Financial data with the data’s numbers at minimum, medium, and maximum percentage.
Slide 45: This slide presents the Mind Map.
Slide 46: This slide is a Timeline template to showcase the progress of the steps of a project with time.
Slide 47: This is a Thank You slide where details such as the address, contact number, email address are added.
Workforce Optimum Utilization Planning Powerpoint Presentation Slides with all 47 slides:
Use our Workforce Optimum Utilization Planning Powerpoint Presentation Slides to effectively help you save your valuable time. They are readymade to fit into any presentation structure.


-
Attractive design and informative presentation.
-
Great experience, I would definitely use your services further.
-
Designs have enough space to add content.
-
Visually stunning presentation, love the content.