


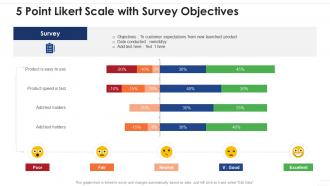
5 point likert scale with survey objectives





Try Before you Buy Download Free Sample Product
 Impress Your
Audience
 100%
Editable
 Save Hours
of Time


Our 5 Point Likert Scale With Survey Objectives are topically designed to provide an attractive backdrop to any subject. Use them to look like a presentation pro.
People who downloaded this PowerPoint presentation also viewed the following :
5 point likert scale with survey objectives with all 2 slides:
Use our 5 Point Likert Scale With Survey Objectives to effectively help you save your valuable time. They are readymade to fit into any presentation structure.

FAQs for 5 point likert scale
Likert scales offer several key advantages including standardized responses, easy quantitative analysis, reduced survey bias, high respondent comprehension, and flexible application across diverse topics. These structured rating systems enhance data reliability by enabling statistical analysis, streamline comparison between respondent groups, and ultimately deliver actionable insights, with many organizations finding that consistent scaling improves decision-making accuracy.
Determining the ideal number of Likert scale points depends on your research objectives, respondent sophistication, and desired data granularity, with 5-point and 7-point scales being most common for general surveys. While 5-point scales offer simplicity and higher response rates, 7-point scales provide greater statistical variance and precision, with many researchers finding that odd-numbered scales enable neutral responses while even-numbered scales force decisive positioning.
Common pitfalls include using unclear or leading wording, mixing positive and negative statements inconsistently, offering too many or too few response options, and creating unbalanced scales. These design flaws can compromise data quality by introducing bias, confusing respondents, and reducing measurement reliability, with many researchers finding that pilot testing helps identify and address these issues before full implementation.
Analyzing Likert scale data effectively involves calculating central tendencies like means and medians, examining frequency distributions, and conducting correlation analyses to identify patterns across responses. These statistical approaches enable organizations to quantify customer satisfaction, employee engagement, and market research insights, with many businesses finding that systematic analysis reveals actionable trends for strategic decision-making.
The primary difference lies in response granularity, with 5-point scales offering basic agreement levels (strongly disagree to strongly agree) while 7-point scales provide more nuanced differentiation through additional moderate categories. Many researchers find that 7-point scales capture subtler opinions and deliver enhanced statistical reliability, though 5-point scales streamline respondent experience and reduce survey fatigue.
Cultural context significantly influences Likert scale responses through varying communication styles, social desirability biases, and interpretation of rating scales across different societies. While Western cultures often embrace direct feedback and extreme ratings, many Asian and collectivist cultures show acquiescence bias and central tendency, preferring moderate responses, ultimately requiring researchers to adapt scales and interpret data through cultural lenses for accurate insights.
Likert scales can support qualitative research by providing structured numerical data that researchers convert into qualitative insights through thematic analysis, content analysis, and interpretive frameworks. While primarily quantitative tools, these scales enable researchers to explore attitudes, perceptions, and experiences in educational studies, market research, and social sciences, with many finding that combining Likert responses with open-ended questions delivers richer, more comprehensive qualitative understanding.
Neutrality in Likert scales provides respondents an option when they genuinely lack opinion or feel indifferent, though it presents both analytical challenges and opportunities for deeper insights. While some researchers remove neutral options to force decisive responses, many organizations find that including neutrality captures authentic sentiment patterns, especially in employee satisfaction surveys and customer feedback systems, ultimately delivering more accurate data representation and strategic decision-making capabilities.
Interpreting Likert scale results in presentations involves analyzing response distributions, calculating mean scores, identifying patterns across demographic segments, and highlighting statistically significant differences between groups. These insights enable organizations to transform raw survey data into actionable business intelligence, with many companies finding that visual representation of agreement levels, neutral responses, and correlation patterns ultimately delivers clearer stakeholder understanding and more informed strategic decision-making.
**INPUT**: What types of questions work best with a Likert scale format? **OUTPUT**: Likert scales work best with opinion-based questions measuring attitudes, satisfaction levels, frequency of behaviors, agreement with statements, and perceived importance of factors. These scales excel in customer satisfaction surveys, employee engagement assessments, and market research studies, enabling organizations to quantify subjective responses and identify trends across demographics, ultimately delivering actionable insights for strategic decision-making. [Word count: 60 words]
Improving Likert scale response rates involves optimizing survey length, using clear language, providing balanced scale options, and ensuring mobile-friendly design. Strategic placement within surveys, personalized invitations, and follow-up reminders significantly enhance participation, while organizations like retail companies and healthcare providers find that offering incentives and explaining survey importance ultimately delivers higher completion rates and more reliable data insights.
Scale wording significantly influences respondent comprehension by determining clarity, consistency, and response accuracy across different demographics and contexts. Poor wording creates confusion, leading to misinterpretation and unreliable data, while clear, balanced language enhances understanding and delivers more accurate insights, with many organizations finding that strategic wording optimization improves survey reliability and respondent engagement.
**INPUT**: How do you address response bias in Likert scale surveys? **OUTPUT**: Response bias in Likert scale surveys is addressed through strategic survey design, including randomizing question order, using balanced scales with equal positive and negative options, and incorporating reverse-scored items. Organizations enhance data reliability by ensuring anonymity, providing clear instructions, and testing surveys with pilot groups, ultimately delivering more accurate insights for strategic decision-making across departments.
Strategies include using simple, direct language, avoiding double-barreled questions, ensuring response options are balanced and clearly defined, and pretesting with target audiences. These approaches enhance data quality by minimizing respondent confusion, reducing survey fatigue, and improving response accuracy, with many organizations finding that clear Likert scales deliver more reliable insights for strategic decision-making.
Advanced statistical methods enhance Likert scale analysis through factor analysis, structural equation modeling, ordinal regression, and item response theory, which reveal deeper patterns than basic descriptive statistics. These techniques enable researchers to identify underlying constructs, test complex relationships between variables, and assess measurement reliability, with organizations in market research and healthcare finding that sophisticated analysis delivers more actionable insights and strategic decision-making capabilities.
-
Great designs, Easily Editable.
-
Perfect template with attractive color combination.