Competitive benchmarking metrics ppt powerpoint presentation outline

Rating:
90%
Competitive benchmarking metrics ppt powerpoint presentation outline
Slide 1 of 2
Favourites Favourites

Try Before you Buy Download Free Sample Product

Audience Impress Your
Audience
Editable 100%
Editable
Time Save Hours
of Time
The Biggest Sale is ending soon in
0
0
:
0
0
:
0
0
Rating:
90%
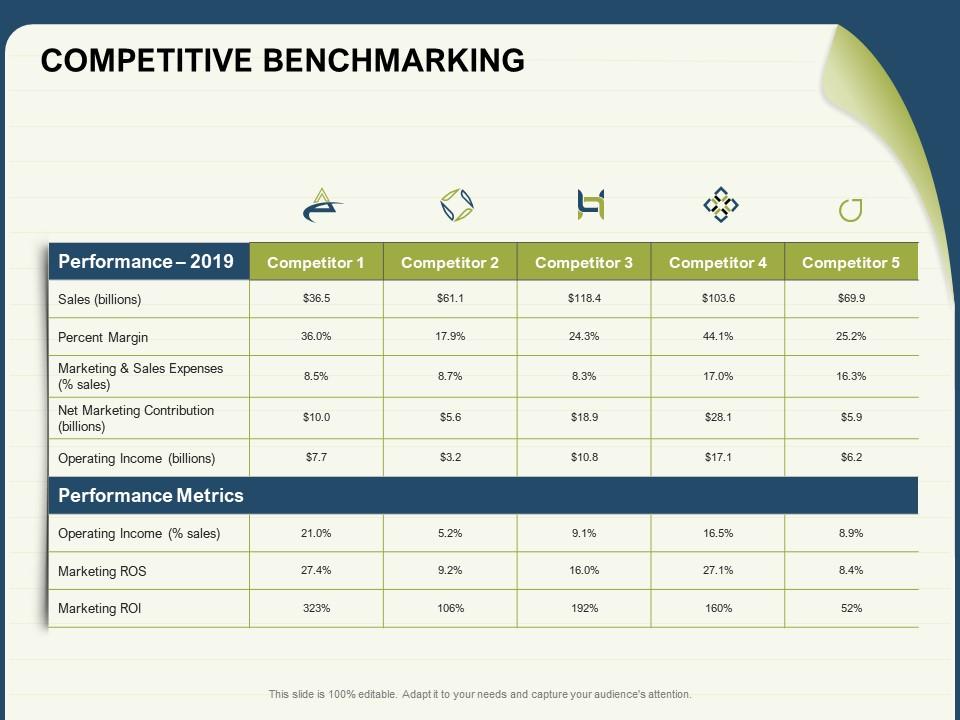
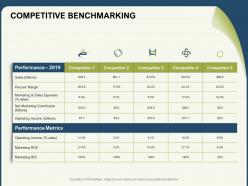
Presenting this set of slides with name Competitive Benchmarking Metrics Ppt Powerpoint Presentation Outline. The topics discussed in these slides are Performance, Performance Metrics, Competitor, Percent Margin, Operating Income. This is a completely editable PowerPoint presentation and is available for immediate download. Download now and impress your audience.

FAQs for Competitive benchmarking metrics ppt

Pick metrics that actually move the needle - market share, revenue growth, customer acquisition costs. Those tell you where you really stand. Customer satisfaction and employee retention matter too, plus how fast you're shipping product updates. Pricing is obviously critical. Honestly, most companies track way too much stuff. Stick to maybe 5-7 things that matter for your specific industry. I'd set up quarterly check-ins to watch for patterns. Way better to catch trends early than scramble when things go sideways. The operational metrics can be just as telling as the financial ones sometimes.

Honestly, don't overthink this - just look at three types. Direct competitors selling similar stuff to your people. Then indirect ones solving the same problem but differently. Plus those aspirational brands you'd love to be like someday (we all have them, right?). Start with who your customers actually compare you to when they're deciding. That's your real competition. Pick maybe 3-5 max so you can dig deep instead of doing shallow research on everyone. Check review sites and see what your sales team hears. Also search your main keywords - you'll spot the ones that actually matter pretty quick.

Market share's probably your best bet for seeing how you stack up against competitors. You can measure it by revenue, units sold, whatever works for your business really. The thing is, it shows you pretty clearly if you're gaining ground or getting crushed over time. Just make sure you're consistent with how you track it - don't compare random stuff. Oh and define your market segment first, that's crucial. I'd check it quarterly so you catch trends before they bite you. It's honestly way more useful than most metrics people obsess over.

Don't trust just one source - that's how you end up making terrible decisions. Mix industry reports with your own competitor digging and third-party data to double-check everything. I totally screwed this up once and built our whole plan around numbers that were like six months old, ugh. Document where every single piece of info comes from so your team isn't guessing later. Start with maybe 3-4 metrics you can actually verify instead of going crazy with data collection right away. Once you nail those, then you can get fancy with more benchmarks.

Bar charts work way better than those messy tables nobody can read. Color-code everything consistently - green when you're winning, red when you're not. Always throw in industry benchmarks so people actually know what the numbers mean. I swear, half the decks I see just dump data without any real point. Show the gaps that actually matter for your strategy. Scatter plots are solid too for comparisons. After each slide, ask yourself "so what?" - like what's leadership supposed to do with this info? That's honestly the difference between charts that drive decisions and ones that just look nice.

Numbers only tell you what's happening, but qualitative stuff shows you why your competitors are crushing it. Customer reviews, social sentiment, how their UX actually feels - that's where you find the real gold. Like, you might see your market share dropping in the data, but qualitative research reveals they're winning because customers love their new checkout flow or whatever. It's messier to track than hard metrics, but honestly? It predicts what's coming next way better. I'd pick 2-3 qualitative things that match your current dashboard and check them monthly with your regular numbers.

Look, focus on the metrics that actually matter: cost per unit, how well you're using your assets, and cycle times. Those move the needle. Labor productivity is solid if you're in manufacturing or services - way more useful than revenue per employee, which honestly just makes executives feel good. Here's the thing though - don't compare yourself to random benchmarks. Find top performers in YOUR specific industry and see how you stack up against them. That's where the real insights are. Start by figuring out which bottlenecks are bleeding you dry, then track the right metrics to see if you're actually closing the gap with competitors.

Pick the metrics that actually matter to your business - revenue growth, customer satisfaction, whatever drives real results for you. Then see how you stack up against your top competitors or industry leaders. Honestly, it's usually pretty humbling when you see the gaps! But those gaps become your action plan. Focus on closing the biggest ones first, the stuff that'll actually move the needle. Don't waste time on vanity metrics that just make your presentations look pretty. I learned this the hard way - spent months tracking meaningless numbers once.

So basically track your NPS, CSAT scores, and retention rates against competitors. Getting their data is honestly the hardest part - industry reports sometimes break it down by company, but those can be pricey. Review sites and social media are goldmines for this stuff though. I'd build a simple dashboard mixing your internal numbers with whatever competitor info you dig up. Oh, and don't go crazy - pick 2-3 metrics that actually matter in your space first. You can always add more later once you've got the basics down.

Honestly, I'd say quarterly at the bare minimum - but monthly's way better if you can swing it. Fast-moving stuff like tech really needs those monthly check-ins or you'll get blindsided. Markets are just too crazy these days to wait around. For basic stuff like pricing and features, quarterly works fine. But don't overthink it - consistency beats being perfect every time. Just throw it on your calendar and actually do it, even if some updates are super quick. I've watched too many people get wrecked by outdated data because they kept putting it off.

SEMrush and Ahrefs are your best bets for digging into competitor keywords and traffic data. SimilarWeb's great for broader website analytics too. I'm probably on these way more than I should be, but once you start seeing what competitors are doing, it's hard to stop lol. For social stuff, Sprout Social works well. Pricing tools like Prisync can automatically track when competitors change their prices - super helpful if that's your thing. My advice? Pick whichever one addresses your biggest gap first, then add more tools later. Don't try to do everything at once or you'll get overwhelmed.

Honestly, benchmarking is like having a cheat sheet for your business decisions. You'll see exactly where competitors are crushing you and spot opportunities you missed. I always tell people to pick 3-4 metrics that actually matter to your goals - don't go overboard with data just because you can. The best part? Leadership suddenly listens when you've got real numbers backing up your ideas. It makes prioritizing so much easier too. My last boss was skeptical about everything until I started showing him industry benchmarks. Then boom - instant credibility.

Honestly, just stick to three key things: where you get your data, being upfront about it, and not being a total dick about what you do with it. Only use stuff that's publicly available - no sneaky corporate spy nonsense or pretending to be someone you're not to get insider info. Tell your team exactly what data you're working with and how you got it. And here's the thing - don't turn around and directly rip off competitors or try to screw them over. I've watched teams go down that rabbit hole and it always bites them later. Focus on improving your own game instead. Set those boundaries early about what's cool to collect and what isn't.

Honestly, focus on CTR, CPA, conversion rates, and ROAS first - those tell you what's actually making money vs. just bleeding cash. If you're doing social or email stuff, toss in engagement rates and open rates too. Compare your numbers to industry averages using SEMrush or Google's benchmark reports so you're not flying blind. Pick maybe 3-4 metrics that actually connect to revenue and obsess over those. Don't get distracted by vanity metrics right away - I learned that the hard way when I was tracking everything under the sun but still couldn't figure out why campaigns weren't profitable.

Oh totally, you can still benchmark against the big guys - just pick smarter metrics. Don't bother with revenue comparisons (obviously), but look at stuff like engagement rates, customer satisfaction, conversion rates. Big companies suck at being personal and quick, which is where you shine. I'd track things like social media engagement per follower, how well you retain customers, maybe local market share in your specific area. Honestly, start small with like 2-3 metrics that actually matter to your customers and check them monthly. You'll probably be surprised how well you stack up in areas that count.

Ratings and Reviews

90% of 100
Review Form
Write a review
Most Relevant Reviews
  1. 80%

    by Clint Perry

    Nice and innovative design.
  2. 100%

    by Charlie Jones

    It saves your time and decrease your efforts in half.

2 Item(s)

per page: