


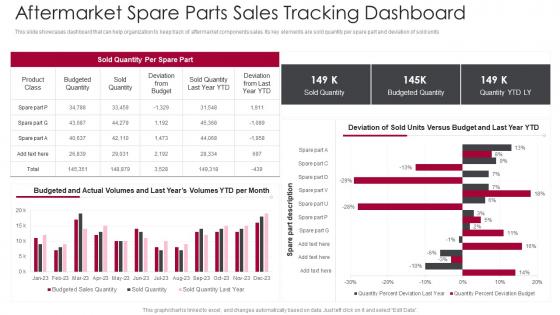
Aftermarket Spare Parts Sales Tracking Dashboard




Try Before you Buy Download Free Sample Product
 Impress Your
 Audience
 100%
100% Editable
 Save Hours
 of Time


This slide showcases dashboard that can help organization to keep track of aftermarket components sales. Its key elements are sold quantity per spare part and deviation of sold units.
People who downloaded this PowerPoint presentation also viewed the following :
Aftermarket Spare Parts Sales Tracking Dashboard with all 7 slides:
Use our Aftermarket Spare Parts Sales Tracking Dashboard to effectively help you save your valuable time. They are readymade to fit into any presentation structure.






FAQs for Aftermarket Spare Parts
First thing - get real-time inventory tracking so you actually know what's sitting on your shelves. Search functionality is huge too, especially for part numbers because honestly, trying to find obscure parts manually is a nightmare. You'll want automated reorder alerts or you'll keep running out of stuff people actually buy. Integration with whatever systems you're already using is a must. Mobile access is basically expected now. Oh, and reporting helps you figure out what's trending. I'd say start with whatever's driving you crazy about your current setup and work backwards from there.
Honestly, analytics just turns your hunches into real data you can actually use. You'll see which parts are collecting dust and which ones you're always scrambling to restock. Seasonal patterns become super obvious - like when certain car models start having brake problems around the same time each year. The predictive stuff is where it gets interesting though. Set your reorder points automatically instead of manually updating everything monthly (such a time suck). You can spot demand spikes before they hit and avoid that panic of telling customers "sorry, we're out." Way better than the old guessing game.
Your aftermarket parts dashboard is only as good as the inventory data feeding it. Real-time stock levels, lead times, and demand patterns - that's what turns pretty charts into actual decision-making tools. I've seen too many people obsess over dashboard design while their data connection sucks. You'll end up overstocking expensive stuff and running out of basic parts customers actually want. The whole point is spotting slow movers, predicting stockouts, and keeping carrying costs reasonable. First step? Get your inventory system talking directly to the dashboard. Trust me, manual updates will drive you insane.
Okay so basically you're hooking your dashboard directly into your ERP system, which is pretty sweet. Your inventory levels, order statuses, customer data - all that stuff updates automatically instead of you having to chase it down manually. No more headaches where your dashboard says you have 50 widgets but your ERP says 12. You can set up triggers too, like reorder alerts when stock gets low. I'd probably start with connecting inventory and sales modules first since those are usually the most painful to track manually. The whole thing just makes everything way more accurate and saves you tons of time honestly.
Dude, start simple with fill rate and inventory turnover - basically are you getting parts to people when they need them. Stock-out frequency too. Financial side, track your gross margin per part and overall revenue growth. Oh and don't forget customer stuff like fulfillment times and return rates. Honestly? The data gets nuts fast if you try tracking everything at once. Pick maybe 4-5 things that actually matter to your business first. You can always add more later once you figure out what's moving the needle. I made that mistake early on - had like 15 different metrics and couldn't focus on anything.
Honestly, generic dashboards are pretty much garbage for actual work. You end up scrolling past tons of metrics you don't care about. But customization changes everything - suddenly you can focus on what actually matters to you. Like if you're managing inventory, put those stock levels for your bestsellers right up front. Set alerts for the stuff that'll bite you if it goes wrong. I always tell people to pick 3-4 things they check most often and build around those first. Way better than trying to customize everything at once. Once you can rearrange widgets and filter by your categories, you'll actually use the thing daily.
Honestly, getting all your spare parts data to play nice together is gonna be your biggest headache. ERP systems, inventory stuff, customer service platforms - they're all speaking different languages. Clean up that messy data first though, or you'll just build a pretty dashboard full of garbage. People hate change too, so good luck getting everyone to actually use it once it's done. Oh, and don't get sucked into tracking every metric that looks cool - half of them won't matter for actual decisions. The integration part still gives me nightmares from my last project.
So predictive analytics basically looks at your old data and figures out patterns - like seasonal stuff, how much you use equipment, failure rates. Way smarter than just winging it honestly. The system crunches machine age, maintenance schedules, even weather conditions to predict what parts you'll need months out. You can actually optimize inventory without having random expensive parts collecting dust (learned that one the hard way). Cuts down on those "oh crap we're out" moments too. I'd start with your priciest or most critical parts first and test demand forecasting on those.
Hey! So for aftermarket dashboards, I'd start with trend lines and bar charts - they're killer for tracking parts demand over time and comparing different SKUs. Heat maps are solid too, especially for spotting regional hotspots. Personally? I'm obsessed with gauges for inventory levels because they scream "red alert" when stock gets low. Just don't go nuts with pie charts when you've got like 50 part categories - total mess. Oh, and maybe start simple with 3-4 key visuals that actually tell your story, then expand from there.
So basically, user roles are huge for dashboard efficiency. You want your inventory managers seeing all the parts data while sales people only get customer stuff - otherwise everyone's drowning in info they don't need. Trust me, nothing kills productivity faster than having to dig through a million irrelevant reports. Short sentences work better for focus. Also prevents that nightmare scenario where everyone's editing the same stuff and messing things up. I'd start by figuring out who actually needs what level of access first, then match permissions to what people do day-to-day. Makes finding the right data way faster.
Set up automated alerts for when your inventory numbers look weird - trust me, you don't want phantom stock sitting there for weeks like what happened to us. Your team needs to update part statuses right when they get new stock or ship orders, not later. Any delay will screw up your whole dashboard. Also get everyone using the same naming system for parts or you'll have duplicates everywhere (learned that one the hard way too). The trick is making data entry part of what people do every day, not some catch-up task they dread.
So basically, get a dashboard that tracks your spare parts and you'll spot tons of sustainability opportunities. Track which parts get replaced constantly - some probably just need refurbishing instead of tossing. I was shocked when I first saw how much stuff we were scrapping unnecessarily. Set up alerts for your high-volume replacements, that's your goldmine right there. You can also monitor which suppliers are actually green vs just talking about it. Plus it stops you from making too many parts that'll just collect dust in storage.
Honestly, real-time data is a game changer for spare parts. You get instant visibility instead of relying on last week's reports that are already useless. Current stock levels, demand patterns, usage rates - it's all happening live. Spot shortages before they hit. Your reorder points actually make sense now because they're based on real consumption data. Way less excess inventory sitting around, fewer panic buys too. Oh and the dashboard thing - it flips everything from putting out fires to actually planning ahead. I'd start with your most critical parts first, track those metrics religiously.
Look, your field techs are bouncing between job sites all day - they can't drag laptops around everywhere. They need to check part numbers and inventory right there on their phones while staring at busted equipment. Nothing's worse than a tech who can't find what they need in the moment. Your mobile dashboard has to actually work on small screens with buttons you can tap without wanting to throw your phone. Otherwise you'll have cranky technicians and customers asking why repairs are taking forever. Trust me, a smooth mobile experience keeps everyone way happier.
Predictive analytics is where it's at right now - your dashboard will literally tell you which parts are about to fail before they actually do. Pretty crazy stuff. AI demand forecasting is getting insanely good too, so no more awkward "oops we're sold out" moments. Blockchain for supply chain tracking is picking up steam, plus AR support for technicians. Oh and mobile-first design isn't going anywhere obviously. Honestly I'd start small with just basic predictive features if you haven't yet. Your customers will definitely appreciate the heads-up approach instead of reactive fixes.
-
Really like the color and design of the presentation.
-
Great designs, Easily Editable.