


As is to be process ppt model




Try Before you Buy Download Free Sample Product
 Impress Your
 Audience
 100%
100% Editable
 Save Hours
 of Time


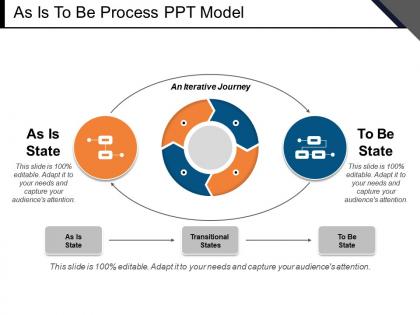
With the ever changing business environment the processes of your business also needs to be changed from time to time.So we at Slide Team have crafted a presentation template on “As is to be process PPT model” for you to incorporate in your meetings.This template will help you to deal with any kind of organisational change.It could be people,goals or processes. This PPT model shows the journey from present state to the future state in a form of a diagram which can be easily be understood by the viewers of the presentation.The diagram focuses on both the states to be interactive with each other which will help the company to achieve its vision mission and goals. Senior managers of an organisation can use this process model to implement strategies and make smooth transitions between present and future. So, without wasting much time, download our extensively researched upon PPT topic and present it with confidence and much ease. Our As Is To Be Process Ppt Model are full of freebies. Get a lot of facilities at no extra cost.
People who downloaded this PowerPoint presentation also viewed the following :
As is to be process ppt model with all 5 slides:
Invigorate jaded folks with our As Is To Be Process Ppt Model. Bring back the intensity of excitement.

FAQs for As is to be
First thing - nail down your scope and map what's actually happening now. Grab all your stakeholders, inputs, outputs, decision points, the whole mess. Exception handling is huge because that's honestly where most processes fall apart in practice. Include timing and who's responsible for what so you can track performance down the road. Oh, and make sure you can measure outcomes somehow. The trick is keeping it simple enough that people will actually use the thing instead of just nodding politely and ignoring it completely.
Honestly, process modeling is a game changer for finding where your workflows are totally screwed up. Map out what you're currently doing and you'll be shocked at the obvious problems - like why does that one approval take three weeks? Or why is everyone entering the same data twice? Once you see it visually, fixing the redundancies and automating the boring stuff becomes way easier. Your team will actually know who's supposed to do what instead of everyone tripping over each other. Just pick one messy process to start with and you'll spot the quick fixes right away.
So the usual suspects are Microsoft Visio, Lucidchart, and draw.io for basic stuff. Bizagi, Signavio, and Camunda handle the heavy-duty business process modeling, but honestly? They're kind of a pain to learn at first. If you're already using Microsoft everything, Visio plays nice with Office. Lucidchart's solid for team collaboration since it lives in the cloud. My take: start with draw.io because it's free and you can figure out what you actually need. Then upgrade later if you want fancy features like simulation - though most people never end up using that stuff anyway.
Honestly, process modeling is like finally having a map everyone can read. You know how explaining workflows gets messy with back-and-forth emails? This fixes that. Your business people, IT folks, operations team - they all look at the same visual and get it immediately. No more "wait, what do you mean by that step?" conversations. Plus when stuff needs to change (and it always does), you can point to exactly what gets affected. Makes getting approval way smoother since people actually see the impact instead of just hearing about it.
Don't overcomplicate things right off the bat - I made this mistake so many times. You'll create something nobody wants to touch. Start with the main scenario that covers most cases, maybe 80%. The weird edge cases? Add those later. Talk to people actually doing the work instead of guessing what they need. My assumptions are usually way off anyway. Keep it visual and simple enough that someone could walk through it quickly and get it. Oh, and honestly? Going lean first saves you tons of headache down the road. Test it out, then build on what works.
Process modeling is like having a map of how work actually flows through your company. Map out your biggest pain-in-the-ass process first - you'll instantly see where things get stuck or duplicated. The cool thing is you can test different fixes without screwing up real work (trust me, operations hates when you experiment on live processes). It helps teams get on the same page about how stuff should work. You can track metrics over time and simulate changes before rolling them out. Honestly, most people skip this step and just wing it, but having that visual makes spotting improvements way easier.
Build your process models like Lego blocks from day one - modular pieces you can swap around without everything falling apart. Don't hardcode specific departments or tools that'll inevitably change. I learned this the hard way when our entire compliance team got reshuffled last year and half our models became paperweights. Keep things abstract enough to bend but detailed enough to actually help people. Oh, and set up those feedback loops with frontline workers - they'll tell you when your fancy model doesn't match reality. Quarterly reviews catch problems before they snowball.
Look, data analysis is honestly the difference between building something useful versus just drawing pretty pictures. Grab your historical data first - cycle times, where things get stuck, weird patterns you missed before. I always start with basic timing stuff because even that makes models so much better. Then you can play around with "what-if" scenarios before you actually change anything (saves tons of headaches). The other thing is processes change constantly, so keep checking your data to update models. Otherwise you'll end up with something that worked great six months ago but doesn't match reality anymore.
Yeah, totally doable! Keep your models super lightweight though - don't go crazy with documentation upfront. Just map enough to help your team spot what's broken and where to improve. I've watched teams get completely stuck overthinking this stuff (it's painful to see honestly). Treat those models like they're alive - update them every sprint as you learn new things. Sticky notes work great during retros for sketching out problem areas. Oh and start tiny! Pick one messy workflow per sprint and just iterate on it. Basic flowcharts are your friend here.
Focus on clarity first - that's the biggest thing. BPMN notation works well for standardization. Keep diagrams clean without cramming too much text everywhere. Always add a legend because people forget what symbols mean (I do this constantly). Document who does what at each step, plus timing when it actually matters. Version control saves your sanity since processes change all the time. Here's what really works though: test your documentation on someone fresh. If they're confused, it needs work. Nobody wants to decipher spaghetti diagrams at 2pm on a Tuesday.
Dude, visuals are a game changer. Your brain actually gets it when you can see the workflow instead of reading through boring paragraphs. Bottlenecks jump out at you. Dependencies make sense. People actually listen during meetings when there's a diagram - honestly, nobody reads those bullet point lists anyway. When stakeholders can point at stuff and ask questions, discussions get way better. You'll catch mistakes and redundant steps that would've flown under the radar otherwise. Just start with basic flowcharts. Even simple boxes with arrows beat walls of text every single time.
Manufacturing and healthcare get massive benefits from this stuff. Financial services love it too - mainly for staying compliant and managing risk. Pharmaceuticals, oil & gas, logistics... basically any industry where screwing up costs serious money or puts people in danger. What's funny is I've noticed these companies always start by mapping their messiest processes first, which honestly makes sense. High-stakes operations with tons of regulations are perfect candidates. If you're in one of these fields, definitely focus on whatever keeps you up at night process-wise. That's where you'll see the biggest impact.
So process mapping is basically your visual game plan for staying compliant and catching risks early. Map out your workflows and you'll spot where regulations kick in, plus see potential screw-ups before they actually happen. Think of it as your overhead view of what might go sideways (and honestly, something usually does). Build checkpoints and approval steps right into the design. When auditors show up, you've got solid documentation proving how you handle compliance. Oh, and definitely tackle your riskiest processes first - no point starting with the easy stuff.
Honestly, process mining tools are game-changers - they'll show you what's really going on vs what you assume is happening. AI automation and low-code platforms are everywhere now. Digital twins are pretty cool too, letting you test stuff without breaking your actual processes. Cloud solutions beat those clunky desktop tools we dealt with before (thank god). Real-time process mining is huge. Customer journey mapping is expanding beyond the usual boundaries too - which makes sense since customers don't care about your internal silos anyway. I'd mess around with some process mining first if you haven't yet.
Honestly, just pick 2-3 metrics that actually matter for your situation. Cycle time is big - how much faster are things running now vs before? Error rates too, obviously. I'd also track if people are actually using your models because what's the point otherwise, you know? Compliance scores matter if that's your thing. User feedback tells you way more than spreadsheets sometimes. Oh and definitely measure cost savings - bosses love that stuff. The main question is pretty simple though: did you solve what you set out to fix? Don't overthink it with like 15 different metrics.
-
Easy to edit slides with easy to understand instructions.
-
Great designs, really helpful.