

 0 Comment
 Customer Reviews

“ If you're not benchmarking your performance against your competitors, you're just playing with yourself. “ — Al Paison, Director of Telspan.
Comparisons are often called thieves of joy. While too much comparison unsettles any efficient organization, there is no way better way to track your growth. You can evaluate your company's situation synchronically and get to an ontological reality, or you can apply a diachronic method. To simplify this, you can put your current performance against your competitors or your previous performances to know how you are faring. You can even adopt a combined approach for a more complete judgment.
Both approaches require benchmarks. You may have recorded 5% more growth in the current quarter than the previous one, yet you remain behind in the market. The same applies to comparing yourself with your market challengers. There are no better criteria to decide whether or not your results are positive unless you have overall industry benchmarking data insights.
Benchmarking, however, does not simply help with comparisons and statistics but also greatly improves the quality of products and services. It is essential for a performance gap analysis to help identify and accept the best internal practices while rejecting destructive ones. Further, it aids in filtering and rewarding the best performers and solving competence problems in humans and machines.
Even in terms of threats, you know what situations are manageable and when you need to take emergency steps without panicking in every situation.
With all these benefits, SlideTeam encourages you to explore our benchmarking report templates, which are introduced further in this blog. These slides serve as peer comparison reports, and only when you compete with the best can you become the best yourself.
Want to plan an elaborate study of your benchmarking scorecard? Combine these templates with these benchmarking analysis templates.
Template 1: Benchmark Comparison Powerpoint Ppt Template Bundles
Every company requires quality raw materials, competent employees, and a strong security system to rise above market norms and deliver exceptional products and services. Purchasable end products also require a strong organizational structure. This bundle, with its 20 templates, helps you choose the best products, projects, employees, business and data security software, and subscription models after intensive performance comparison analysis.
Explore it to study every product using several benchmark categories, such as average price, sales rank, home delivery, document management, video quality, and data privacy. Compare the individual employee efficiency and project success using comparative benchmarks to weigh them.
[product_image id=874305]
Template 2: Global Benchmark Powerpoint PPT Template Bundles
These 11 distinct slides inform you about global benchmarks in different sectors and provide a strong industry standards assessment using reliable metrics. Use them to measure your email marketing campaign’s results on global parameters such as click-through rate, click-to-open rate, and bounce rate. Compare your numbers to these benchmarks to target and maintain excellence. Build a similar strategy around your finances to better sanction your budget.
These templates also allow you to add your data interpretation in the key insights section. During the presentation, use global statistics to convince your stakeholders of the advantages of keeping up with industry benchmarks.
[product_image id=694348]
Template 3: Information System Security Benchmark Dashboards
This dashboard combines more than one key performance indicator (KPI) analysis in one slide to run a security diagnosis of your information system. Indicators like Botnet activity, Malicious process monitoring, and Network anomalies probe your system to expose its malware susceptibility. It also uses the information to reveal the number of systems passing the compliance benchmark. Grab this template to fix or eliminate the techniques failing the benchmark test.

Template 4: Organizational Performance Benchmark Report For Periodic Employee Evaluation
This template contains everything you need for your employee performance review sessions. It lists the expected performance goals and the skills, processes, and methods an employee must learn first and upgrade at regular intervals to achieve positive outcomes and a healthy work atmosphere. This template sets the standard practices an employee must adopt and increases their productivity. Use it to communicate the company’s prior requirements and evaluate the work transparently.

Template 5: Performance Benchmarking Report For Effective Supply Chain Process
An effective supply chain process is detailed and meticulous. Parameters like parity, advantage, superior, and gap qualitatively analyze this process. Every company wants to achieve the best numbers on all such parameters in different performance attributes. This slide uses suitable evaluation metrics to conduct a process benchmarking review and mentions the industry standard numbers in attributes such as accuracy, flexibility, or expense so you can stay updated with progress.

Template 6: Procurement Price Benchmarking Analysis Report With Key Metrics
Imagine building an NBA team and knowing how to differentiate between average and match-winning players. Knowing the performance of the above-average, below-average, and best players would help you sign the best available options. This benchmarking scorecard template helps your business similarly by incorporating procurement price industry performance in metrics like savings, spending under management, and enabled suppliers. You can aim to achieve best-in-class numbers or anything over the market average.

Template 7: Benchmarking Report of Supply Chain Management Tasks
This performance comparison analysis template adopts a percentile strategy to rank your supply chain management performances in the best, average, and worst categories. It utilizes several KPI numbers to approve or reject your performance. These KPIs include Delivery in full, Delivery on time, Cash to cash cycle time, and Stockturn. These numbers are based on a thorough productivity benchmarking study and are reliable. Use this slide for a quality performance analysis.

Template 8: Learning Benchmark for All Students Presentation Report Infographic PPT PDF Document
This template is a great advert for selling your courses since it is based on operational efficiency comparison. Comparative analysis examines the proficiency of different courses in a school against the backdrop of statewide proficiency standards. Modify both tables to inform your customers about testing numbers, proficient numbers, and proficient percentages in both schools and across the state in different years. Apply the upward-line charts to visualize the data.

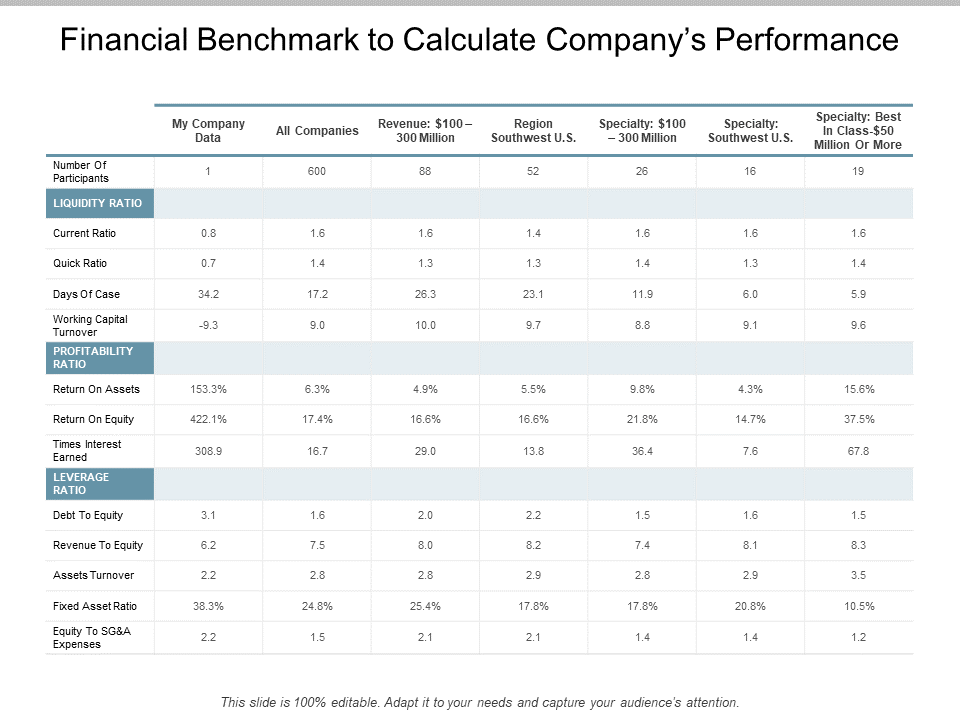
Template 9: Financial Benchmark to Calculate Company’s Performance
This slide contextualizes your balance sheet or income statement in the entire market scenario, giving it a whole new perspective. Applying the competitive benchmarking strategy pits your liquidity ratios, profitability ratios, and leverage ratios against the market numbers by breaking them into components such as return on asset and debt to equity. The template further divides the companies in terms of market size, regions, and specialties for more nuanced standardization.
Template 10: Competitive Procurement Price Benchmarking Analysis Dashboard
Data visualization is an effective method for producing the desired impact during a presentation. This infographic strengthens your points during the meeting by presenting the return cost, rejection rate, and spend under management analysis of your procurement price employing bar graphs and trend charts. Additionally, this all-in-one template helps you identify the best suppliers using this peer comparison report that ranks them based on their quality scores.

Conclusion
Dealing with so much delicate data requires sensitivity. Your business needs updated metrics and KPIs to contextualize every piece of information. We validate these metrics using benchmarking metrics reports where they fulfill the standard expectations for you to trust them and their outcomes.
You can also encourage transparency and consistency in interpreting market positioning reports. Our benchmarking presentation templates help you follow a flawless structure and apply relevant indicative KPIs.
Strengthen the core of your business with our organizational report templates, which we have designed to track your milestones and future outlook with regular reports.