0 Comment
 Customer Reviews

The deck's been shared. Twenty-three slides. Color-coded quadrants, financial targets, customer satisfaction metrics, internal process KPIs, learning and growth objectives.
Nobody's read past slide three.
Not because the content's wrong. It's probably accurate—pulled from last quarter's reports, cross-referenced with the strategy doc that took six weeks to finalize. But somewhere between "here's what we're tracking" and "here's what it means," the room goes quiet in the wrong way. Eyes drift. Someone checks their phone.
The problem isn't the data. It's the gap between having a scorecard and presenting one that actually lands. Because an organizational scorecard isn't a spreadsheet you dress up. It's an argument—a coherent case for where the organization is, what it's prioritizing, and why those choices make sense right now.
And that's harder than it looks. Most teams know their numbers. The tricky part is structuring them so leadership can see the logic at a glance. Financial metrics next to customer outcomes next to internal process indicators—it only makes sense if the layout does half the explaining. If the visual hierarchy says "here's the story" before anyone reads a single number.
So the templates exist. Not because nobody knows what a Balanced Scorecard is, but because building a presentation that makes the strategic performance management argument clearly—every time, under deadline, without starting from a blank slide—is genuinely hard. That's a real problem, and it's common enough that pre-designed frameworks for it have become standard.
SlideTeam's organizational scorecard templates handle exactly this. Content-ready layouts that map financial, customer, internal, and growth dimensions the way they're meant to be shown—connected, not just listed. Ready-made structures for when you know what you're tracking but need the presentation to do the work of making it coherent.
Here are the templates that work.
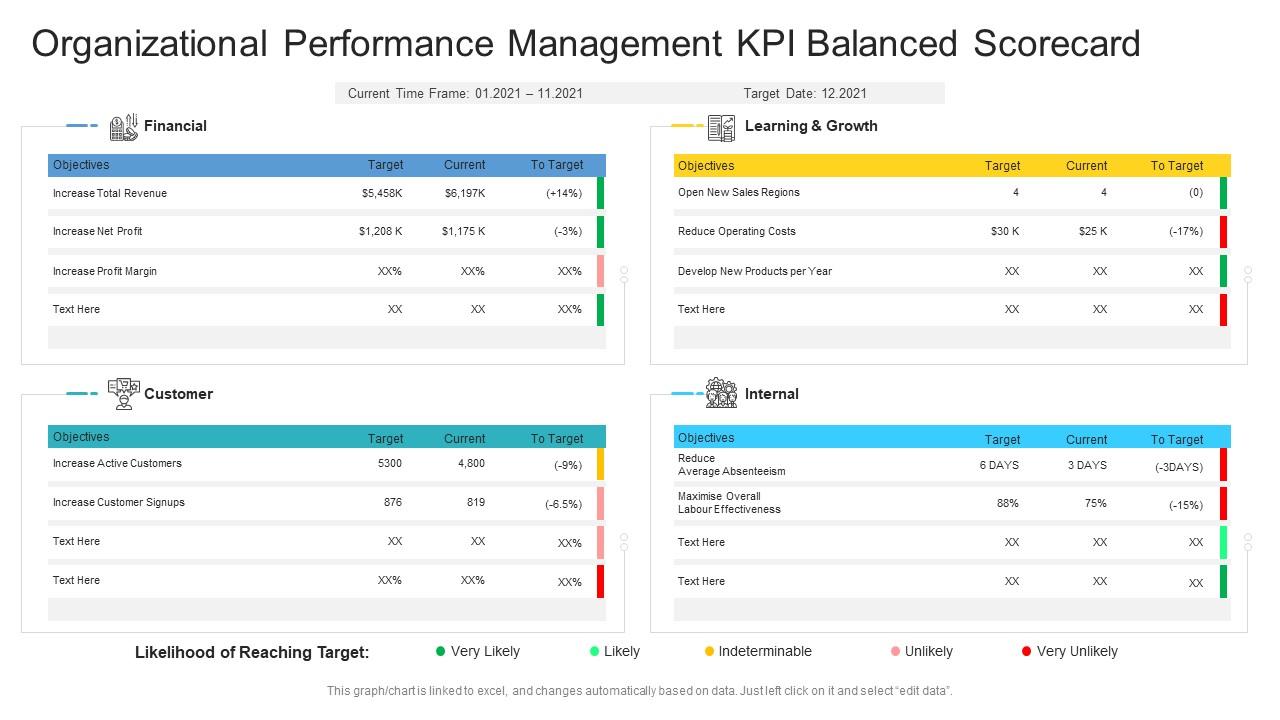
Template 1: Organizational Performance Management KPI Balanced Scorecard
Tracking organizational health across multiple dimensions demands a clear, structured visual framework. This PowerPoint slide covers Financial, Customer, Internal, and Learning & Growth perspectives in one cohesive view. It gives KPI owners and strategy leads an instant read on where performance stands. For teams building a Balanced Scorecard presentation under time pressure, this PPT is a reliable starting point. The template is 100% editable and customizable.
Download this PowerPoint Template
Template 2: Creating a Balanced Scorecard Strategy Map to Drive Organizational Success PPT Presentation
A strategy map only works when the causal links between objectives are visible and credible. This PPT preset is built for strategy leads who need to show how financial outcomes connect to customer and internal process goals. It's particularly useful when walking a leadership team through a Balanced Scorecard narrative for the first time. Explore curated organizational scorecard examples to see how similar decks are structured in practice. The template is 100% editable and customizable.
[product_image id=1639157]
Template 3: Implementing Employee Scorecards in Your Organization PPT Information
Employee scorecards only work when people understand what they're being measured on and why. This deck empowers HR teams and department heads to build transparent, role-specific performance frameworks. Each layout drives clarity around individual KPIs, making the link between day-to-day tasks and organizational goals visible. Customizable elements let you tailor each section to your department's unique business performance metrics. Transform your employee performance reviews with a structured, professional approach. Download this dynamic template now and make every scorecard conversation count.
[product_image id=1627420]
Template 4: Using Balanced Scorecard to Measure Organizational Performance PPT Summary
Measuring organizational performance means different things at different levels of the business. This slide is built for practitioners who need to present Balanced Scorecard findings to mixed audiences—finance, operations, and HR in the same room. It structures measurement across perspectives cleanly, so leadership can follow the logic without a lengthy briefing. For strategy teams preparing a performance measurement system review, this PPT preset gets the argument on the page fast. The template is 100% editable and customizable.
[product_image id=1750738]
Template 5: Balanced Scorecard Metrics to Drive Organizational Performance PPT Structure
Scorecard metrics only drive performance when they're tied to a clear organizational context. This PPT template is designed for performance analysts and COOs who need to present KPI progress across financial, customer, and operational dimensions. It works equally well in quarterly business reviews and board-level strategy sessions. The deck makes complex business performance metrics readable at a glance, without sacrificing the depth leadership needs. The template is 100% editable and customizable.
[product_image id=1584533]
Template 6: Balanced Scorecard Metrics for Measuring Organizational Performance PPT Summary
Presenting Balanced Scorecard metrics to a senior audience requires more than accurate numbers—it requires a clear story. This PPT preset gives strategy and finance leads a structured way to surface what's working, what isn't, and why it matters. It supports measurement across the four core scorecard perspectives with a layout that guides the reader's eye. For teams running a performance review process on a recurring cycle, this slide saves significant preparation time. The template is 100% editable and customizable.
[product_image id=1725739]
Template 7: Balanced Scorecard Strategy Map for Organizational Alignment PPT
Organizational alignment breaks down when teams optimize locally without seeing the bigger strategic picture. This deck is built for strategy officers and planning leads who need to show how departmental objectives connect to enterprise-wide goals. It maps the Balanced Scorecard perspectives to a visual alignment structure that boards and senior teams can act on. For anyone preparing a strategic objectives alignment session, this PPT template makes the connective logic explicit and credible. The template is 100% editable and customizable.
[product_image id=1611430]
Template 8: Designing a Team Performance Scorecard for Organizational Growth PPT Example
Team-level scorecards are where organizational strategy actually gets tested. This PPT preset is built for department heads and team leads who need to track progress against group KPIs and report upward with confidence. It structures performance data in a way that connects individual contributions to organizational growth targets. For managers running regular performance tracking conversations, this slide gives the meeting a clear, shared reference point. The template is 100% editable and customizable.
[product_image id=1563308]
Template 9: Balanced Scorecard Benefits for Organizational Performance PPT Structure
Articulating why a Balanced Scorecard matters to skeptical stakeholders requires more than a list of benefits. This deck delivers a clear, benefit-forward case for adopting scorecard-based performance management across the organization. Structured layouts let you walk leadership through financial clarity, customer alignment, and internal process gains without losing the thread. Use this framework to build organizational buy-in before rolling out a full Corporate Performance Management initiative. Transform your stakeholder conversations with evidence-backed, professionally structured arguments. Download this dynamic template now and make the case for performance-driven leadership.
[product_image id=1733778]
Template 10: Balanced Scorecard Aligning Strategy with Organizational Performance PPT Information
Connecting strategy to day-to-day performance is where most scorecards fall short. This deck gives strategy and operations leaders a clear framework for presenting how organizational objectives translate into measurable KPIs at every level. Each slide drives the alignment argument forward, linking financial targets, customer outcomes, and internal process metrics in one coherent view. Customizable layouts let you adapt the narrative to quarterly reviews, annual planning cycles, or executive briefings. Transform your strategic alignment presentations with a professional, results-oriented structure. Download this dynamic template now and close the gap between planning and execution.
[product_image id=1836526]
Template 11: Driving Organizational Alignment with Balanced Scorecard PPT Information
Organizational alignment is a recurring leadership concern, not a one-time exercise. This slide is built for strategy leads and COOs who need to present how a Balanced Scorecard creates coherence across business units and functions. It surfaces the linkage between strategic priorities and operational decisions in a format senior audiences can absorb quickly. For teams running an Enterprise Performance Management cycle, this PPT preset structures the alignment conversation with authority. The template is 100% editable and customizable.
[product_image id=1482701]
Template 12: Balanced Scorecard for Organizational Growth
Growth-oriented organizations need scorecard frameworks that scale as priorities shift. This PPT template gives planning leads and senior executives a structured way to track financial, customer, and operational progress against long-term growth targets. It works as a standalone board-level summary or as part of a larger strategic planning cycle. For teams building out a Business Scorecard Template for the first time, this deck provides a credible, clean starting structure. The template is 100% editable and customizable.
[product_image id=1831398]
Template 13: HR Scorecard Boosting Organizational PPT Information
HR functions that can't quantify their contribution to organizational performance lose influence at the leadership table. This PPT preset gives HR leads a structured format for presenting people metrics—headcount, turnover, capability development—alongside business outcomes. It connects HR activity to organizational impact in a language finance and operations leaders recognize. For HR Scorecard presentations in quarterly reviews or board reporting cycles, this slide does the heavy framing work. The template is 100% editable and customizable.
[product_image id=1857547]
Template 14: Key HR Scorecard Metrics to Drive Organizational Success PPT Sample
Key HR metrics only move the needle when leadership can see them in context. This deck is built for CHROs and HR business partners who need to present performance data that directly links people outcomes to organizational success. It structures hiring efficiency, retention rates, and capability indicators alongside strategic HR objectives. For HR Scorecard reporting in high-stakes executive sessions, this PPT template gives the data the credibility it deserves. The template is 100% editable and customizable.
[product_image id=1625639]
Template 15: Organizational Data Maturity Scorecard PPT Example
Data maturity is a real gap in most organizations—few leaders have a clear picture of where they actually stand. This PPT template is built for data officers and IT leads who need to assess and communicate data capability levels across the business. It structures maturity across dimensions like governance, infrastructure, and analytics readiness in a format leadership can act on. For IT Scorecard reviews or digital transformation planning sessions, this slide gives the maturity conversation a concrete, visual anchor. The template is 100% editable and customizable.
[product_image id=1581638]
Template 16: Strategic Scorecard for Organizational Digital Growth PPT Outline
Digital growth scorecards need to track both technology adoption and the business outcomes that adoption is supposed to drive. This deck empowers digital transformation leads and strategy officers to present progress across initiatives, KPIs, and organizational readiness metrics in one place. Each layout creates instant clarity on where digital investment is generating results and where gaps remain. It's built for executive dashboard presentations where time is short and context is everything. Transform your digital performance reviews with a structured, visually compelling scorecard. Download this dynamic template now and drive informed decisions at every leadership level.
[product_image id=1549462]
Template 17: Balanced Scorecard Metrics to Drive Organizational Growth PPT Mockup
Balanced Scorecard metrics only drive organizational growth when they're tracked consistently and presented clearly. This PPT template gives strategy and finance leads a structured mockup for surfacing KPI trends across financial, customer, and operational perspectives. It's designed for teams preparing quarterly business reviews or annual strategy sessions where metric clarity is non-negotiable. For practitioners building out a performance measurement system with leadership buy-in, this deck accelerates the design process significantly. The template is 100% editable and customizable.
[product_image id=1726403]
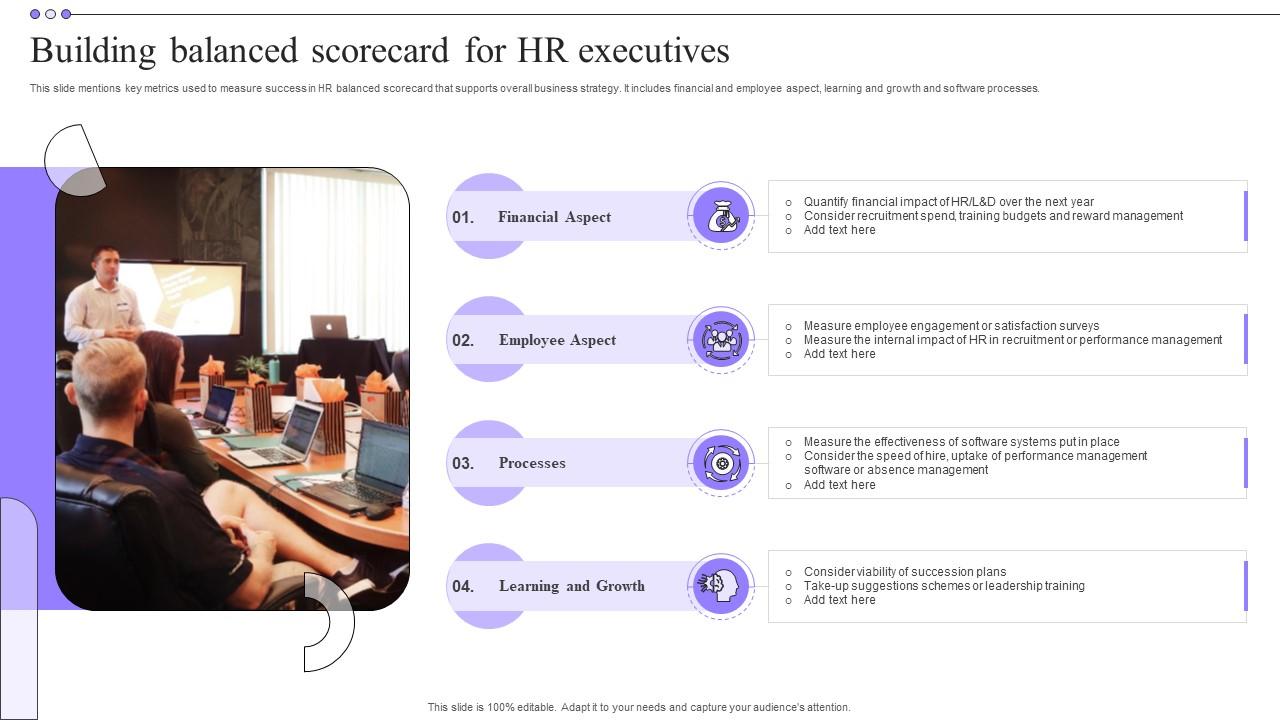
Template 18: Building Balanced Scorecard for HR Executives
HR executives who use Balanced Scorecards need to show how people investments connect to business results. This slide covers the financial, employee, learning and growth, and software process dimensions that matter most in HR reporting. It's built for HR leaders presenting to a CFO or board-level audience that wants cause-and-effect, not just activity metrics. For teams structuring an HR Scorecard that supports the broader organizational strategy, this PPT gives the framework a credible, actionable form. The template is 100% editable and customizable.
Download this PowerPoint Template
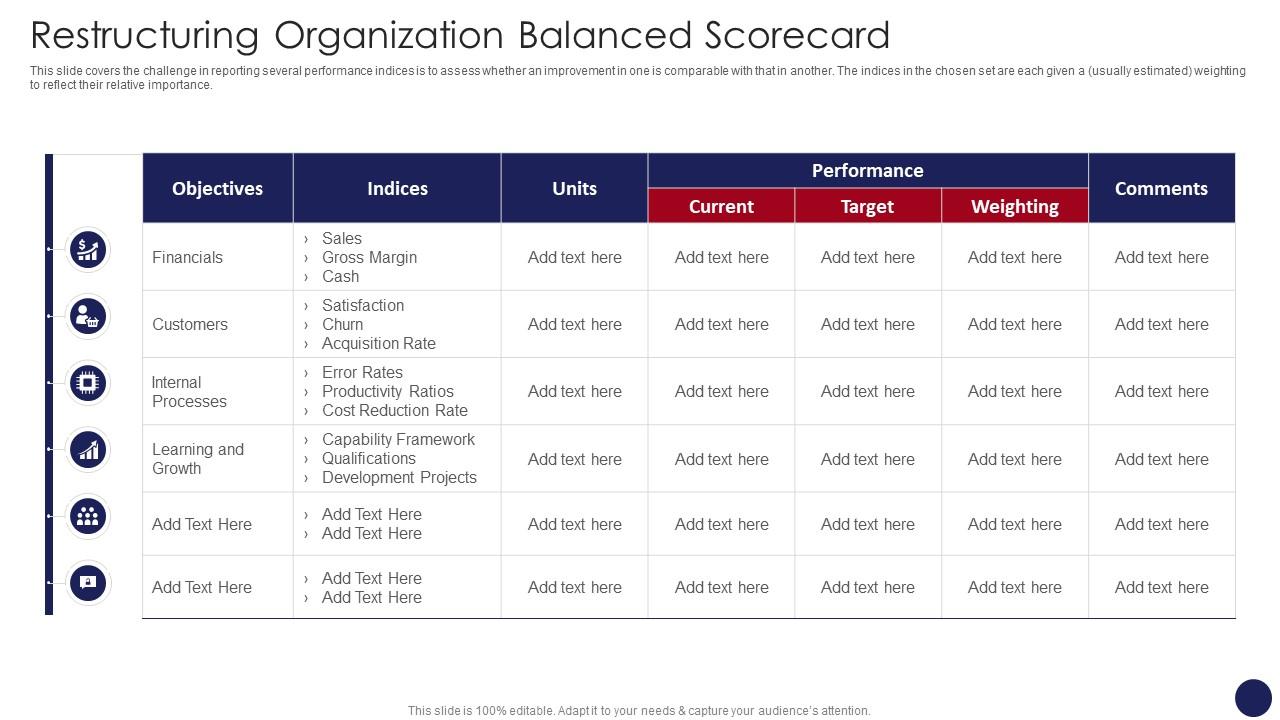
Template 19: Restructuring Organization Balanced Scorecard Organizational Restructuring
Organizational restructuring creates a measurement problem: existing KPIs often don't reflect the new operating model. This PPT preset is built for transformation leads and operations executives who need to track performance across internal processes, capability frameworks, and productivity ratios during a restructuring. It handles the challenge of comparing improvement across different performance indices with a weighted, visual structure. For strategy teams navigating a post-restructuring performance review cycle, this slide provides a clear, defensible reporting framework. The template is 100% editable and customizable.
Download this PowerPoint Template
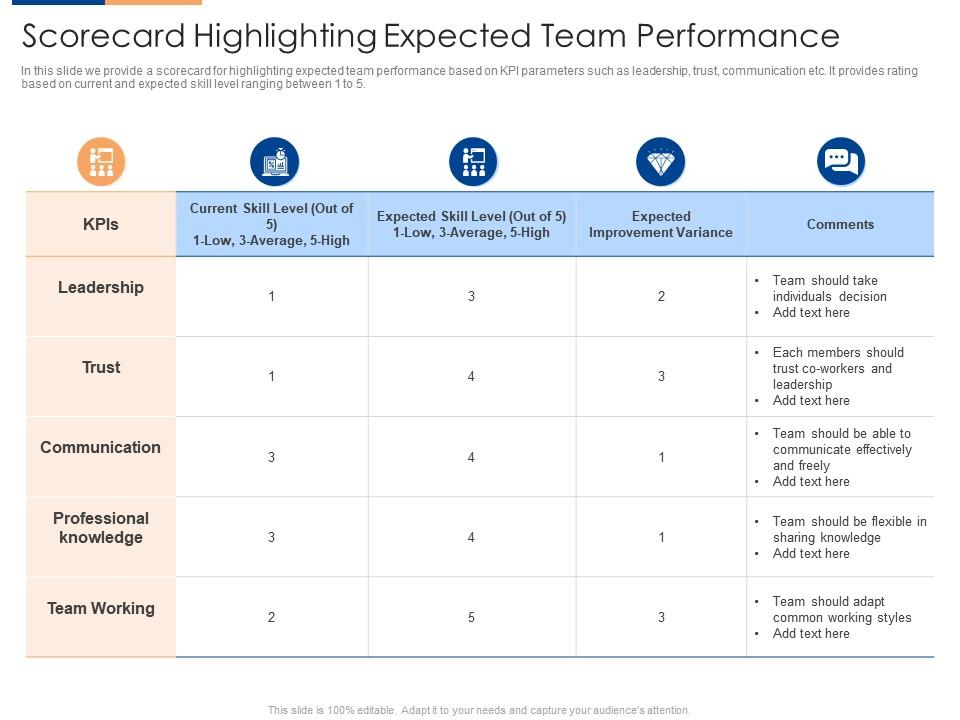
Template 20: Scorecard Highlighting Expected Team Performance Organizational Team Building Program
Team-building programs need measurable outcomes, not just participation counts. This PPT preset gives L&D leads and managers a scorecard that tracks expected versus current skill levels across leadership, trust, communication, and professional knowledge dimensions. It uses a simple 1-to-5 rating structure that makes gap analysis fast and the development conversation concrete. For HR teams running an organizational team building program with clear KPI accountability, this slide makes the results visible and discussable. The template is 100% editable and customizable.
Download this PowerPoint Template
Elevate Every Performance Conversation with SlideTeam
SlideTeam's PowerPoint templates are the best in the industry for organizational scorecard presentations. These content-ready slides cover every dimension—financial, customer, internal, and growth—so your leadership team always has the full picture. Use these ready-made frameworks to turn raw KPI data into clear, strategic narratives that drive decisions. Deploy these PowerPoint slides to align your teams, communicate performance with confidence, and keep strategy execution on track.
FAQs on Organizational Scorecard
How does an organizational scorecard differ from a traditional performance review system?
A traditional performance review looks backward—it grades past behavior, usually annually, through a manager's lens. An organizational scorecard tracks performance in real time across multiple strategic dimensions: financial, customer, internal process, and learning. It connects individual and team results to overall business targets. The key difference is direction: reviews assess people; scorecards assess organizational health and strategic progress.
What are the core components that every effective organizational scorecard must include?
Every effective organizational scorecard needs four things: clear strategic objectives, measurable KPIs tied to each objective, targets that define what success looks like, and a defined owner for each metric. Without owners, accountability disappears. Without targets, KPIs are just numbers. Most failures trace back to missing one of these four—usually the targets or the owners.
How can a balanced scorecard be adapted for nonprofit organizations versus for-profit enterprises?
For nonprofits, the financial perspective shifts from profit to sustainability and donor ROI. The customer perspective becomes beneficiary or community impact. Internal processes focus on program delivery efficiency rather than margin. The learning and growth dimension stays largely the same. The Balanced Scorecard structure holds—what changes are the metrics that define success within each quadrant.
What financial metrics should be prioritized when building an organizational scorecard for a startup?
Startups should prioritize cash burn rate, revenue growth rate, and customer acquisition cost—these are survival metrics. Unit economics (LTV to CAC ratio) matter early because they predict whether the model is viable. Gross margin tells you if the product can ever be profitable at scale. Avoid vanity metrics like total users; track metrics that connect directly to funding runway and growth trajectory.
How do you align individual employee KPIs with broader organizational scorecard objectives?
Start at the top: identify two or three organizational scorecard objectives that each team is directly responsible for. Break each into department-level KPIs. Then break department KPIs into individual targets. The logic should cascade cleanly—if every person hits their number, the team hits its KPI, and the organizational objective moves. Review alignment quarterly; misalignment usually appears within one or two cycles.
What role does data visualization play in making scorecard insights actionable for leadership teams?
Leadership teams make faster decisions when data is visual. A well-designed KPI dashboard surfaces trends, outliers, and gaps in seconds—without requiring anyone to read a table. Color-coded status indicators reduce meeting time and shift the conversation from 'what happened' to 'what do we do next.' Poor visualization buries the insight; the meeting ends with more questions than actions.
How often should an organization recalibrate its scorecard metrics to stay aligned with strategic shifts?
Review the scorecard metrics every quarter, but only recalibrate when strategy shifts—not on a fixed calendar. If the organization changes a key objective, the supporting KPIs must update within the same planning cycle. Annual recalibrations tied to the strategy planning process are the minimum. Metrics that no longer connect to strategic priorities become noise and should be dropped immediately.
What are the most common pitfalls organizations face when implementing a scorecard for the first time?
The three most common pitfalls: tracking too many metrics (more than five to seven per perspective dilutes focus), choosing metrics that are easy to collect rather than strategically meaningful, and failing to assign clear owners. A fourth pitfall is building the scorecard without leadership buy-in—when executives don't use it in decisions, the whole system loses credibility within two quarters.