


Fixed Asset Investment Valuation Powerpoint Presentation Slides


Try Before you Buy Download Free Sample Product
 Impress Your
 Audience
Editable
of Time


Understand the need for fixed capital evaluation by using Fixed Asset Investment Valuation PowerPoint Presentation Slides. The presentation contains various templates discussing the current situation analysis of the company and the need for fixed capital evaluation. Factors affecting the requirement of fixed capital and sources can be presented through our PPT slide design. You can also provide detail on fixed asset management software with its price and features. Take the assistance of the asset revaluation PowerPoint slideshow, to describe the need for fixed capital evaluation in the company. Depict the implementation plan to evaluate the fixed capital of the company. The sources of fixed capital such as issues of share, right share, and debenture can be showcased with these attention-grabbing PPT visuals. Take the assistance of these tangible assets PPT template to showcase the capital expenditure details. Explain various capital expenditure methods by using these PowerPoint infographics. Highlight the need for fixed capital investment such as land, building, plant, and machinery by downloading professionally designed long-term investment presentation ppt slides.
People who downloaded this PowerPoint presentation also viewed the following :
Content of this Powerpoint Presentation
Slide 1: This slide introduces Fixed Asset Investment Valuation. State your Company name and begin.
Slide 2: This slide displays Agenda.
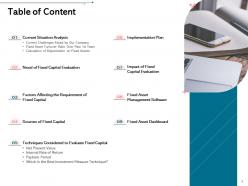
Slide 3: This slide shows Table of Content.
Slide 4: This slide shows table of contents.
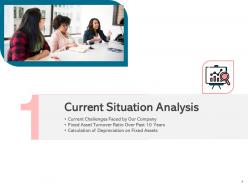
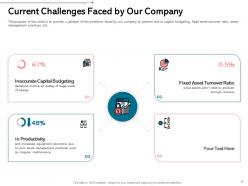
Slide 5: The purpose of this slide is to provide a glimpse of the problems faced by our company at present due to capital budgeting, fixed asset turnover ratio, asset management practices, etc.
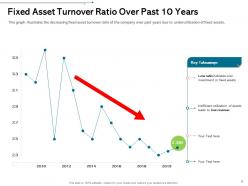
Slide 6: This graph illustrates the decreasing fixed asset turnover ratio of the company over past years due to underutilization of fixed assets.
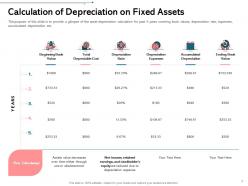
Slide 7: The purpose of this slide is to provide a glimpse of the asset depreciation calculation for past 5 years covering book values, depreciation rate, expenses, accumulated depreciation etc.
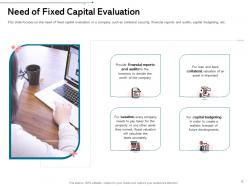
Slide 8: This slide showcases Need of Fixed Capital Evaluation.
Slide 9: This slide focuses on the need of fixed capital evaluation in a company such as collateral security, financial reports and audits, capital budgeting, etc.
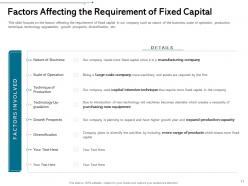
Slide 10: This slide shows Factors Affecting the Requirement of Fixed Capital.
Slide 11: This slide focuses on the factors affecting the requirement of fixed capital in our company such as nature of the business, scale of operation, production technique, technology upgradation, growth prospects, diversification, etc.
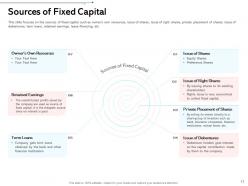
Slide 12: This slide displays Sources of Fixed Capital.
Slide 13: This slide focuses on the sources of fixed capital such as owner’s own resources, issue of shares, issue of right shares, private placement of shares, issue of debentures, term loans, retained earnings, lease financing, etc
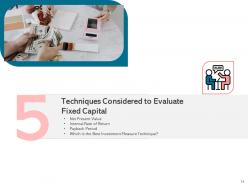
Slide 14: This slide shows Techniques Considered to Evaluate Fixed Capital
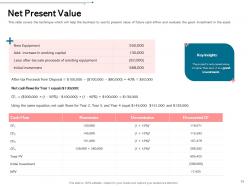
Slide 15: This slide covers the technique which will help the business to see its present value of future cash inflow and evaluate the good investment in the asset.
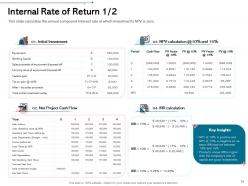
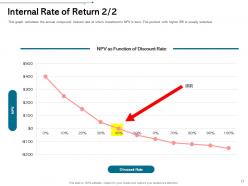
Slide 16: This slide calculates the annual compound interest rate at which investment’s NPV is zero.
Slide 17: This graph calculates the annual compound interest rate at which investment’s NPV is zero. The product with higher IRR is usually selected.
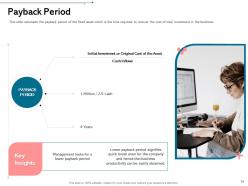
Slide 18: This slide calculates the payback period of the fixed asset which is the time required to recover the cost of total investment in the business.
Slide 19: This slide evaluates the best technique which our company will consider to evaluate the organization’s fixed capital.
Slide 20: This slide showcases Implementation Plan.
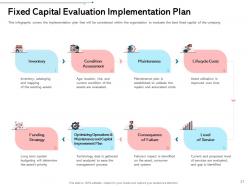
Slide 21: This infographic covers the implementation plan that will be considered within the organization to evaluate the best fixed capital of the company.
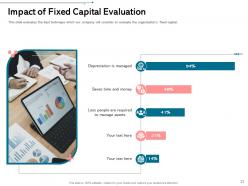
Slide 22: This slide showcases Impact of Fixed Capital Evaluation.
Slide 23: This slide evaluates the best technique which our company will consider to evaluate the organization’s fixed capital.
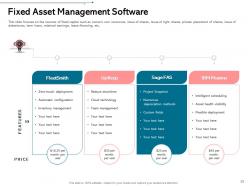
Slide 24: This slide showcases Fixed Asset Management Software.
Slide 25: This slide focuses on the sources of fixed capital such as owner’s own resources, issue of shares, issue of right shares, private placement of shares, issue of debentures, term loans, retained earnings, lease financing, etc.
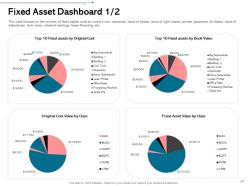
Slide 26: This slide displays Fixed Asset Dashboard.
Slide 27: This slide focuses on the sources of fixed capital such as owner’s own resources, issue of shares, issue of right shares, private placement of shares, issue of debentures, term loans, retained earnings, lease financing, etc.
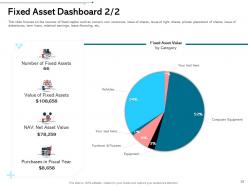
Slide 28: This slide focuses on the sources of fixed capital such as owner’s own resources, issue of shares, issue of right shares, private placement of shares, issue of debentures, term loans, retained earnings, lease financing, etc.
Slide 29: This is Icons Slide for Fixed Asset Investment Valuation.
Slide 30: This slide is titled as Additional Slides for moving forward.
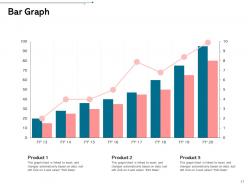
Slide 31: This slide displays Bar Graph with product comparison.
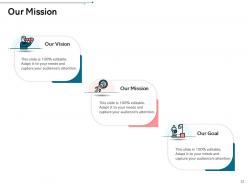
Slide 32: This slide displays Mission, Vision and Goals.
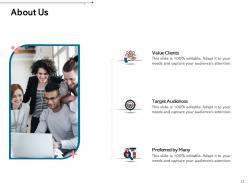
Slide 33: This is About Us slide to showcase Company specifications.
Slide 34: This is Our team slide with Names and Designations.
Slide 35: This is Financial slide with Minimum, Medium and Maximum.
Slide 36: This slide shows Timeline process.
Slide 37: This slide shows Circular Diagram
Slide 38: This is Idea Generation slide to highlight important ideas and facts.
Slide 39: This slide is titled as Post it Notes
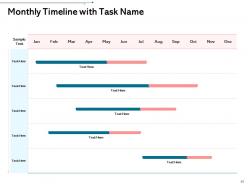
Slide 40: This slide represents Monthly Timeline with Task Name
Slide 41: This is 30 60 90 Days Plan
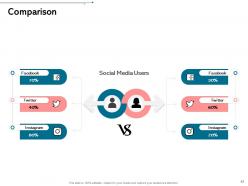
Slide 42: This slide shows Comparison between different social media users.
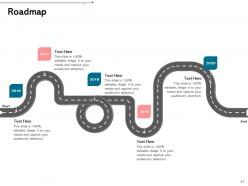
Slide 43: This slide displays Roadmap process.
Slide 44: This is Thank you slide with Contact details.
Fixed Asset Investment Valuation Powerpoint Presentation Slides with all 44 slides:
Use our Fixed Asset Investment Valuation Powerpoint Presentation Slides to effectively help you save your valuable time. They are readymade to fit into any presentation structure.


-
Great experience, I would definitely use your services further.
-
Design layout is very impressive.
-
The content is very helpful from business point of view.
-
Really like the color and design of the presentation.
-
Excellent work done on template design and graphics.
-
Graphics are very appealing to eyes.
-
Attractive design and informative presentation.
-
Appreciate the research and its presentable format.