Top 10 IoT Dashboard PowerPoint Templates with Professional Designs
Save time and engage your audience with our fully editable PowerPoint PPT Templates and Slides.
-

Industrial IOT Dashboard Analytics PPT Designs VA
Your factory floor is generating a goldmine of data every second. The challenge is turning those raw sensor feeds into decisions that actually cut downtime and boost throughput before your competitors even spot the trend. This Industrial IoT Dashboard Analytics PPT designs package transforms complex machine telemetry into clear actionable visual stories. Skip the tangled spreadsheets and give your team presentation graphics that make real time operational health instantly understandable. From predictive maintenance summaries to live production metrics each editable slide is built for engineers and executives alike. Ready to speak the language of smart manufacturing with confidence These modern slide design templates put your analytics front and center ready for your next strategy deck.
-

Home Electricity Monitoring IoT Dashboard PPT Sample VA
Struggling to spot wasteful energy drains before the bill arrives Your homes power usage is a constant stream of data but without the right visual lens those numbers stay buried in silence. This Home Electricity Monitoring IoT Dashboard presentation deck turns raw consumption metrics into clear actionable insights. Walk your audience through real time usage patterns appliance level breakdowns and smart grid integrations without drowning them in spreadsheets. The editable slides and data visualization tools make complex technical concepts approachable for any stakeholder from tech teams to family members. Stop guessing and start presenting a smarter more efficient household story.
-
Industrial IOT Dashboard Machine Monitoring PPT Information VA
Downtime is the silent profit killer in any manufacturing operation. Your production floor generates a flood of sensor data every second but raw numbers mean nothing without a clear way to read them. This Industrial IoT dashboard presentation deck transforms complex machine telemetry into actionable intelligence letting you identify bottlenecks before they escalate into costly failures. Built for plant managers and operations directors these business slides visually map equipment status predictive maintenance triggers and throughput trends through intuitive data visualization. The modern slide design works directly in Google Slides or PowerPoint offering editable slides that adapt to your specific machinery. Present your smart factory strategy with clarity and confidence.
-
Centralized Iot Dashboard PPT Presentation VA
Imagine a powerful centralized IoT dashboard that encapsulates complex data streams into a cohesive visual narrative. This PPT presentation is your gateway to showcasing realtime analytics in a visually captivating manner perfect for corporate strategy sessions or investor pitches. Each slide is meticulously crafted with modern design aesthetics and intuitive layouts allowing you to convey critical insights effortlessly. Engage your audience with dynamic data visualization and infographic templates making your findings not just clear but impactful. With this presentation deck youre not just sharing information youre telling a story of innovation and strategic vision tailored for the interconnected world.
-
Industrial IOT Dashboard Factory Monitoring PPT Slides VA
Watching a production line stall costs more than time it costs contracts. That is the tension this Industrial IoT dashboard presentation resolves transforming scattered sensor data into a single actionable command center. Within these PPT slides complex machine telemetry becomes clear visual storytelling allowing you to spotlight efficiency dips or maintenance alerts before they become headline problems. Tailored for plant managers and operations directors the modern slide design turns raw numbers into executive ready narratives. The Industrial IoT dashboard factory monitoring presentation graphics work directly in Google Slides or PowerPoint giving you flexible editable slides that make your next operations review feel less like a report and more like a strategy session.
-
Cloud Computing Industrial Iot Dashboard PPT Powerpoint VA
Cloud computing and industrial IoT converge in this stunning dashboard PowerPoint presentation where data visualization comes to life through modern slide designs. Perfect for showcasing complex analytics or strategy decks each editable slide is crafted to narrate your story effectively ensuring that your audience remains engaged. With creative layouts that blend technology and business insights this presentation template caters to consultants and executives alike. Seamlessly capture trends and key metrics using infographic templates that provide clarity and impact. Elevate your pitch deck with this essential toolkit for innovation and strategy in the digital age.
-
Cloud Computing Data Processing Iot Dashboard PPT Outline VA
Capturing the essence of cloud computing this dynamic IoT dashboard presentation transforms data processing into a visual narrative. Innovative and engaging the meticulously crafted PPT slides bring your corporate presentation to life enabling audiences to grasp complex analytics at a glance. Each editable slide is designed to showcase your strategy deck with vivid graphics and modern slide design enhancing workflow visualization. As you venture into the world of data insights leverage this presentation bundle to communicate your findings effectively. Dont just present data tell a compelling story that resonates with stakeholders and drives meaningful conversations.
-
Elevator Iot Monitoring Dashboard PPT Presentation VA
A single glitch in an elevator bank can ripple into tenant complaints and costly emergency calls. You need a clear view into every cars health before that happens. This complete presentation deck translates raw sensor data into actionable insights featuring dashboards that flag performance dips in real time. Each slide in this modern slide design helps you communicate uptime stats and maintenance priorities to building owners or investors without drowning them in technical jargon. With editable slides tailored for facility managers and data visualization that makes monitoring obvious at a glance this elevator IoT monitoring dashboard PPT presentation turns complex information into a straightforward narrative for better decisionmaking.
-
Industrial IOT System Dashboard PPT Designs VA
Machines speak in gigabytes per second but your boardroom speaks in clarity. When production halts your team needs an instant view of sensor health line efficiency and operational bottlenecks not a scavenger hunt through raw data. These Industrial IoT System Dashboard PPT designs turn sprawling telemetry into a visual command center that stakeholders actually understand at a glance. Built for executive reviews and investor briefings the animated presentation flows from high level KPIs down to granular equipment diagnostics without losing momentum. Every business slide balances dense metrics with generous whitespace making complex system status feel almost intuitive. Customize the color coding swap in your live data feeds and present with the confidence that your operations story lands crisply every time.
-
IoT Dashboard For Tracking Water Management
This slide showcases dashboard for managing water after introducing IoT. The main purpose of this template is to track water management after IoT. This includes total apartments, purchases, comparisons, etc. Introducing our IoT Dashboard For Tracking Water Management set of slides. The topics discussed in these slides are Total Purchase, Highest And Lowest, Global Comparison. This is an immediately available PowerPoint presentation that can be conveniently customized. Download it and convince your audience.
-
Dashboards Iot PPT Slides VA
Crafting an impactful narrative around IoT data has never been easier with our innovative dashboards IoT PPT slides. These visually dynamic presentation graphics empower you to present complex information with clarity and style. Perfect for corporate presentations or techsavvy startups each editable slide is designed to enhance engagement and understanding. Embrace modern slide design that transforms raw data into insightful visuals while effectively communicating your strategy. Elevate your pitch deck with an array of infographic templates ensuring your audience grasps the significance of your IoT initiatives. Embrace the future of data visualization and make your presentation unforgettable.
-
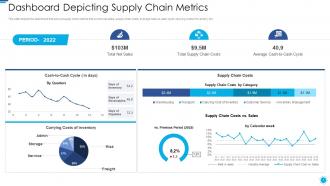
Role of digital twin and iot dashboard depicting supply chain metrics
This slide depicts the dashboard that shows supply chain metrics that covers net sales, supply chain costs, average cash to cash cycle, carrying costs of inventory, etc. Present the topic in a bit more detail with this Role Of Digital Twin And Iot Dashboard Depicting Supply Chain Metrics. Use it as a tool for discussion and navigation on Dashboard Depicting Supply Chain Metrics. This template is free to edit as deemed fit for your organization. Therefore download it now.
-
Iot Dashboard For Tracking Warehouse Pallets Deploying Internet Logistics Efficient Operations
The following slide showcases internet of things IoT dashboard for tracking warehouse pallets. It provides information about transit, plant, client location, active duty, hazardous zone, etc. Deliver an outstanding presentation on the topic using this Iot Dashboard For Tracking Warehouse Pallets Deploying Internet Logistics Efficient Operations. Dispense information and present a thorough explanation of Dashboard, Hazardous, Information using the slides given. This template can be altered and personalized to fit your needs. It is also available for immediate download. So grab it now.
-
Electricity Consumption Dashboard Iot PPT Designs VA
Every kilowatthour tells a story but only if you can see the pattern. This collection transforms raw sensor data into clear actionable insights making your electricity consumption dashboard for IoT PPT designs visually compelling. Each slide is built as an editable slide allowing you to connect realtime metrics with strategic decisionmaking. The modern slide design focuses on data visualization turning complex usage trends into clear executive slides that any stakeholder can grasp. Whether presenting to a utility board or an internal operations team this presentation deck gives your energy narrative the clarity and authority it deserves without any clunky engineering jargon.
-
Iot Dashboard For Tracking Warehouse Pallets Enabling Smart Shipping And Logistics Through Iot
The following slide showcases internet of things IoT dashboard for tracking warehouse pallets. It provides information about transit, plant, client location, active duty, hazardous zone, etc. Deliver an outstanding presentation on the topic using this Iot Dashboard For Tracking Warehouse Pallets Enabling Smart Shipping And Logistics Through Iot. Dispense information and present a thorough explanation of Dashboard, Hazardous, Information using the slides given. This template can be altered and personalized to fit your needs. It is also available for immediate download. So grab it now.
-
IoT Dashboard For Managing Fleet Units Ppt Demonstration
This slide showcases Internet of Things IoT integrated dashboard which can assist logistics managers in fleet management. It provides information about employees, fleet status, truck, car, container, moving units, engine hours, etc. Present the topic in a bit more detail with this IoT Dashboard For Managing Fleet Units Ppt Demonstration. Use it as a tool for discussion and navigation on IoT Dashboard, Managing Fleet Units. This template is free to edit as deemed fit for your organization. Therefore download it now
-
Industrial IOT Telemetry Dashboard PPT Slides VA
Picture a control room where every machine speaks in real time and decisions happen in seconds instead of shifts. That is the reality this Industrial IoT Telemetry Dashboard slide system brings to your operations. Built for engineers and plant managers these PPT slides convert raw sensor streams into clear data visualization so you can spot anomalies before they become downtime. Each editable slide supports live metrics trend graphs and alarm states with modern slide design that keeps your leadership focused on action not noise. Whether you are presenting to floor supervisors or the C suite this presentation deck gives you the visual storytelling power to turn telemetry into insight and insight into output.
-
IOT Dashboard For Tracking Warehouse Pallets Using IOT Technologies For Better Logistics
The following slide showcases internet of things IoT dashboard for tracking warehouse pallets. It provides information about transit, plant, client location, active duty, hazardous zone, etc. Introducing IOT Dashboard For Tracking Warehouse Pallets Using IOT Technologies For Better Logistics to increase your presentation threshold. Encompassed with five stages, this template is a great option to educate and entice your audience. Dispence information on Total Pallets, Pallets Transit, Missing Workplace, using this template. Grab it now to reap its full benefits.
-
Iot Dashboard For Tracking Warehouse Pallets Implementing Iot Architecture In Shipping Business
The following slide showcases internet of things IoT dashboard for tracking warehouse pallets. It provides information about transit, plant, client location, active duty, hazardous zone, etc. Present the topic in a bit more detail with this Iot Dashboard For Tracking Warehouse Pallets Implementing Iot Architecture In Shipping Business. Use it as a tool for discussion and navigation on Dashboard, Location, Workplace. This template is free to edit as deemed fit for your organization. Therefore download it now.
-
Dashboard Internet Of Things PPT Demonstration VA
Discover the future of connectivity with our innovative dashboard for an Internet of Things PowerPoint demonstration. Dive into a realm where data visualization meets modern slide design presenting a captivating narrative of smart devices and integration. These dynamic presentation slides are crafted to showcase IoT solutions expertly making complex information accessible and engaging. Engage your audience with professional graphics and customizable layouts ensuring your corporate presentation makes a lasting impact. Perfect for techsavvy entrepreneurs and industry leaders alike this presentation bundle will elevate your pitch deck combining clarity and creativity for maximum effect.
-
Industrial IOT Data Platform Dashboard PPT Sample VA
Every production stop costs money and hidden inefficiencies erode margins faster than most teams realize. This presentation deck turns raw sensor streams equipment telemetry and operational logs into a visual story your stakeholders will actually understand. With modern slide design built around a data platform dashboard you can walk executives through real time metrics asset health and throughput trends without drowning them in spreadsheets. The editable slides and presentation graphics make it simple to customize for your specific factory floor or supply chain. Whether you are preparing a strategy deck for leadership or a workflow presentation for plant managers this professional PPT gives you the visual storytelling power to drive immediate action.
-
Data Analytics Dashboard Industrial Iot PPT Presentation VA
Delve into the future of industrial innovation with our data analytics dashboard PowerPoint presentation tailored for the IoT landscape. This visually striking presentation deck combines cuttingedge design and strategic insight allowing you to showcase essential metrics and trends through dynamic charts and infographics. With editable slides and modern slide design your audience will be captivated by a compelling narrative that highlights datadriven decisionmaking. The included consulting presentation elements and workflow presentation features make it an invaluable tool for executives and stakeholders alike. Unlock unparalleled potential and drive engagement through expert storytelling with this essential presentation bundle.
-
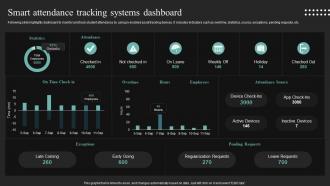
Smart Attendance Tracking Systems Dashboard Iot In Education To Transform IoT SS
Following slide highlights dashboard to monitor and track student attendance by using Io enabled asset tracking devices. It includes indicators such as overtime, statistics, source, exceptions, pending requests, etc. Present the topic in a bit more detail with this Smart Attendance Tracking Systems Dashboard Iot In Education To Transform IoT SS. Use it as a tool for discussion and navigation on Statistics, Attendance. This template is free to edit as deemed fit for your organization. Therefore download it now.
-
IoT Solutions For Transforming Food IoT Based Food Inspection Monitoring Dashboard IoT SS
Following slide highlights dashboard that helps to track and monitor stored food inventory to ensure food safety. It includes indicators such as produce health, storage inventory, incidents, live data, etc. Deliver an outstanding presentation on the topic using this IoT Solutions For Transforming Food IoT Based Food Inspection Monitoring Dashboard IoT SS. Dispense information and present a thorough explanation of Food Inventory, Food Safety, Storage Inventory, Inspection Monitoring Dashboard using the slides given. This template can be altered and personalized to fit your needs. It is also available for immediate download. So grab it now.
-
IoT Applications In Oil And Gas Oil And Gas Production Monitoring KPI Dashboard IoT SS
This slide exhibits monthly performance of oil and gas production to track wellhead uptime and overall efficiency. It includes various elements such as production efficiency, well uptime, gas production rate, oil production rate, top performing gas producing wells, etc. Present the topic in a bit more detail with this IoT Applications In Oil And Gas Oil And Gas Production Monitoring KPI Dashboard IoT SS. Use it as a tool for discussion and navigation on Oil And Gas Production, Monitoring KPI Dashboard, Oil Production Rate, Top Performing Gas. This template is free to edit as deemed fit for your organization. Therefore download it now.
-
Industrial IOT Remote Monitoring Dashboard PPT Guidelines VA
Downtime is the silent killer of margins and you need your operations team to see problems before they spiral. This Industrial IOT Remote Monitoring Dashboard PPT guidelines deck hands you the blueprint for turning raw sensor streams into clear actionable operational intelligence. Instead of drowning in alerts you can present a unified view of machine health energy consumption and production flow. Every section is built around practical data visualization and workflow strategies so your next review board presentation actually drives a decision. The modern slide design and editable slides work across PowerPoint templates and Google Slides letting you build a corporate presentation that proves your facility runs on foresight.
-
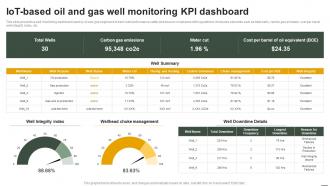
IoT Applications In Oil And Gas IoT Based Oil And Gas Well Monitoring KPI Dashboard IoT SS
This slide presents a well monitoring dashboard used by oil and gas engineers to track well performance safety and ensure compliance with regulations. It includes elements such as total wells, carbon gas emission, cost per barrel well integrity index, etc. Deliver an outstanding presentation on the topic using this IoT Applications In Oil And Gas IoT Based Oil And Gas Well Monitoring KPI Dashboard IoT SS. Dispense information and present a thorough explanation of Well Monitoring Dashboard, Performance Safety, Ensure Compliance With Regulations using the slides given. This template can be altered and personalized to fit your needs. It is also available for immediate download. So grab it now.
-
Industrial IOT Predictive Analytics Dashboard PPT Example VA
Downtime on a factory floor is rarely a surprise if you know where to look. This presentation deck turns raw machine data into a clear story of what will fail and when. You get a complete Industrial IOT Predictive Analytics Dashboard presentation example packed with data visualization slides that make sensor readings and maintenance forecasts instantly digestible for any executive team. The modern slide design uses dark tones and high contrast charts to frame your strategy as a decisive operational edge. Fully editable slides on Google Slides and PowerPoint templates let you adapt the workflow presentation with your own metrics helping you build stakeholder confidence and momentum for proactive maintenance investments.
-
IoT Security Dashboard With User Improving IoT Device Cybersecurity IoT SS
The purpose of this slide is to outline key performance indicator KPI metrics dashboard of IoT security. The major metrics mentioned in slide are alert severity, alert breakdown, entity breakdown, user notification, reset password, authentications request, etc. Present the topic in a bit more detail with this IoT Security Dashboard With User Improving IoT Device Cybersecurity IoT SS. Use it as a tool for discussion and navigation on Security, Notifications, Notification. This template is free to edit as deemed fit for your organization. Therefore download it now.
-
Industrial IOT Connected Machines Dashboard PPT Slides VA
Downtime costs more than repair bills it costs contracts credibility and momentum. That is precisely why your next operational review needs to show command over every sensor pulse and production line heartbeat. These Industrial IoT Connected Machines Dashboard PPT slides turn raw telemetry into a story your stakeholders will actually follow blending live metrics with crisp visual storytelling. Built for engineers and executives alike the deck uses data visualization to bridge the gap between the shop floor and the boardroom. Each editable slide adapts to your workflow so you can present machine health output trends and maintenance triggers with genuine authority. Stop narrating spreadsheets. Start directing the conversation.
-
Waste Collection And Recycling Monitoring Dashboard IoT Driven Waste Management Reducing IoT SS V
This slide presents a waste monitoring dashboard helpful in optimising recycling rate of waste produced. It includes elements such as recycled year to date, sent for recycling, not recyclable, savings returned, recycled year to date by category, etc. Deliver an outstanding presentation on the topic using this Waste Collection And Recycling Monitoring Dashboard IoT Driven Waste Management Reducing IoT SS V. Dispense information and present a thorough explanation of Waste Collection, Recycling Monitoring Dashboard, Optimising Recycling Rate using the slides given. This template can be altered and personalized to fit your needs. It is also available for immediate download. So grab it now.
-
IoT Cybersecurity Dashboard With Open And Improving IoT Device Cybersecurity IoT SS
The purpose of this slide is to showcase Internet of Things IoT security dashboard which can be used by business to analyze impact of IoT security strategies. The major metrics mentioned in slide are open incidents, resolved incidents, open tickets, and resolved tickets. Deliver an outstanding presentation on the topic using this IoT Cybersecurity Dashboard With Open And Improving IoT Device Cybersecurity IoT SS. Dispense information and present a thorough explanation of Cybersecurity, Resolved, Incidents using the slides given. This template can be altered and personalized to fit your needs. It is also available for immediate download. So grab it now.
-
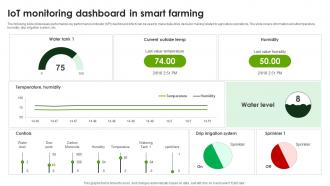
Iot Monitoring Dashboard In Smart Farming Improving Agricultural IoT SS
The following slide showcases performance key performance indicator KPI dashboard which can be used to make data drive decision making related to agriculture operations. The slide covers information about temperature, humidity, drip irrigation system, etc. Present the topic in a bit more detail with this Iot Monitoring Dashboard In Smart Farming Improving Agricultural IoT SS. Use it as a tool for discussion and navigation on Temperature, Humidity. This template is free to edit as deemed fit for your organization. Therefore download it now.
-
Industrial IOT Anomaly Detection Dashboard PPT Example VA
Minutes of unplanned downtime hide inside your sensor streams long before a line stops cold. Spotting those outliers demands more than raw telemetry it demands a view that turns subtle shifts into obvious alarms. This Industrial IoT Anomaly Detection Dashboard presentation deck gives operations teams a clear lens on machine health showing you how to surface irregular patterns before they compound into costly failures. The business slides pair real world data visualization with sharp workflow presentation visuals making complex thresholds feel immediate and understandable. Use these editable slides to align engineers and executives around the same monitoring story proving your predictive strategy works. Every visual element here supports faster decisions clearer communication and tighter operational control.
-
IoT Agriculture Dashboard For Crop Recommendation By Analyzing Various Factors
The template shows the various KPIs of IoT agriculture. This slide aims to measure the moisture level and speed of the wind to evaluate the best crop for harvesting. It includes KPIs such as moisture of soils, climatic condition, monthly, weekly, etc.Presenting our well structured IoT Agriculture Dashboard For Crop Recommendation By Analyzing Various Factors. The topics discussed in this slide are Soil Moisture Detector, Water Consumption, Sensor Location Detecting. This is an instantly available PowerPoint presentation that can be edited conveniently. Download it right away and captivate your audience.
-
Complete Guide For IoT Industrial Dashboard To Track Factory Energy Ppt Slides IoT SS V
Following slide represents dashboard to monist asset performance and energy consumption within factory premises. T covers indicators such as OEE analysis, monthly cost analysis, manpower performance, etc. Present the topic in a bit more detail with this Complete Guide For IoT Industrial Dashboard To Track Factory Energy Ppt Slides IoT SS V. Use it as a tool for discussion and navigation on Industrial Dashboard, Track Factory Energy Consumption, Equipment Effectiveness Analysis. This template is free to edit as deemed fit for your organization. Therefore download it now.
-
Industrial IOT Factory Sensors Dashboard PPT Graphics VA
Every second of unplanned downtime chips away at your bottom line yet the data explaining why often sits buried in complex systems. This deck transforms that raw operational noise into clear actionable intelligence. Built around the Industrial IoT factory sensors dashboard these presentation graphics turn live machine feeds into digestible visual stories for stakeholders at every level. You can walk leadership through real time efficiency gains using modern slide design and crisp data visualization then drill into the technical specifics with executive slides that make sense of sensor arrays and predictive maintenance signals. Whether you need professional PPT layouts for a quarterly review or an investor focused strategy deck these editable slides adapt to your narrative without losing momentum. Stop explaining your factory floor with static charts and start showing its true performance.
-
Internet Of Things In Education Student Data Tracking Application Dashboard IoT SS V
Following slide represents dashboard that provides accurate student data to analyze performance using educational apps. It includes metrics such as grades, attendance, average grades, progress rate, etc. Present the topic in a bit more detail with this Internet Of Things In Education Student Data Tracking Application Dashboard IoT SS V. Use it as a tool for discussion and navigation on Student Data Tracking Application Dashboard. This template is free to edit as deemed fit for your organization. Therefore download it now.
-
IoT Monitoring Dashboard In Smart Smart Agriculture Using IoT System IoT SS V
The following slide showcases performance key performance indicator KPI dashboard which can be used to make data-drive decision making related to agriculture operations. The slide covers information about temperature, humidity, drip irrigation system, etc. Present the topic in a bit more detail with this IoT Monitoring Dashboard In Smart Smart Agriculture Using IoT System IoT SS V. Use it as a tool for discussion and navigation on Water Tank, Value Temperature, Humidity. This template is free to edit as deemed fit for your organization. Therefore download it now.
-
IoT Platform Dashboard For Tracking Smart Analyzing IoTs Smart Building IoT SS
This slide provides a platform dashboard of a utilizes IoT technology for tracking workplace optimization. It includes KPIs for monitoring building visitors, energy consumption report, current building temperature, coffee consumption, room occupancy, etc. Present the topic in a bit more detail with this IoT Platform Dashboard For Tracking Smart Analyzing IoTs Smart Building IoT SS. Use it as a tool for discussion and navigation on Tracking, Workplace, Registered. This template is free to edit as deemed fit for your organization. Therefore download it now.
-
IoT Solutions For Transforming Food IoT Enabled Smart Shelves Monitoring Dashboard IoT SS
Following slide depicts dashboard to monitor IoT based food shelves to assure food quality control and reduce wastage. It includes indicators such as temperature, humidity, weight, current freshness, vibration, etc. Deliver an outstanding presentation on the topic using this IoT Solutions For Transforming Food IoT Enabled Smart Shelves Monitoring Dashboard IoT SS. Dispense information and present a thorough explanation of Dashboard To Monitor IoT, Food Quality Control, Current Freshness, Vibration using the slides given. This template can be altered and personalized to fit your needs. It is also available for immediate download. So grab it now.
-
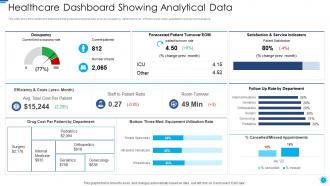
Role of digital twin and iot healthcare dashboard snapshot showing analytical data
This slide shows the healthcare dashboard that presents analytical data such as occupancy, patient turnover, efficiency and costs, satisfaction and service indicators. Deliver an outstanding presentation on the topic using this Role Of Digital Twin And Iot Healthcare Dashboard Snapshot Showing Analytical Data. Dispense information and present a thorough explanation of Healthcare, Dashboard, Analytical using the slides given. This template can be altered and personalized to fit your needs. It is also available for immediate download. So grab it now.
-
Iot energy dashboard showing consumption and voltage powerpoint template
This slide shows the various graphs related to IOT energy dashboard which include the data of number of energy consumption, average power per device. This is a IOT Energy Dashboard Showing Consumption And Voltage Powerpoint Template drafted with a diverse set of graphics, that can be reformulated and edited as per your needs and requirements. Just download it in your system and make use of it in PowerPoint or Google Slides, depending upon your presentation preferences.
-
Iot Monitoring Dashboard In Smart Farming Precision Farming System For Environmental Sustainability IoT SS V
The following slide showcases performance key performance indicator KPI dashboard which can be used to make data-drive decision making related to agriculture operations. The slide covers information about temperature, humidity, drip irrigation system, etc. Deliver an outstanding presentation on the topic using this Iot Monitoring Dashboard In Smart Farming Precision Farming System For Environmental Sustainability IoT SS V. Dispense information and present a thorough explanation of Monitoring, Dashboard, Information using the slides given. This template can be altered and personalized to fit your needs. It is also available for immediate download. So grab it now.
-
IoT Mining Kpi Dashboard With Average How IoT Technology Is Transforming IoT SS
The following slide showcases smart mining key performance indicator KPI dashboard. The key metrics outlined in slide are fleet haulers, model code, average payload, effective utilization rate, average loaded speed, average empty speed, etc.Present the topic in a bit more detail with this IoT Mining Kpi Dashboard With Average How IoT Technology Is Transforming IoT SS. Use it as a tool for discussion and navigation on Iot Mining Kpi Dashboard, Average Payload. This template is free to edit as deemed fit for your organization. Therefore download it now.
-
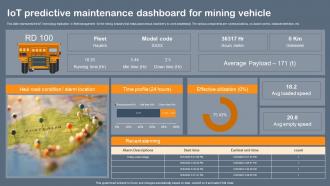
IoT Predictive Maintenance Dashboard For Mining Vehicle
This slide represents the IoT technology implication in fleet management for the mining industry that helps autonomous machinery to work seamlessly. The various components are communications, on board control, obstacle detection, etc. Presenting our well structured IoT Predictive Maintenance Dashboard For Mining Vehicle. The topics discussed in this slide are Predictive, Mining, Maintenance. This is an instantly available PowerPoint presentation that can be edited conveniently. Download it right away and captivate your audience.
-
IOT Fleet Management Dashboard With Vehicle Type IOT Fleet Management IOT SS V
The following slide delineates Key performance indicator KPI dashboard which can assist fleet managers in tracking business operations. The slide covers information about total traffic, traffic by vehicle type, etc. Present the topic in a bit more detail with this IOT Fleet Management Dashboard With Vehicle Type IOT Fleet Management IOT SS V. Use it as a tool for discussion and navigation on Fleet Management, Dashboard With Vehicle Type. This template is free to edit as deemed fit for your organization. Therefore download it now.
-
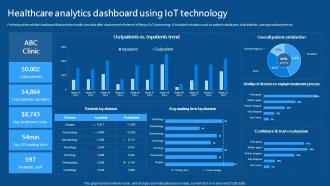
Healthcare Analytics Dashboard Using IoT Technology Comprehensive Guide To Networks IoT SS
Following slide exhibits dashboard that provides health care data after deployment of internet of things IoT technology. It includes indicators such as patient satisfaction, total patients, average waiting time etc. Present the topic in a bit more detail with this Healthcare Analytics Dashboard Using IoT Technology Comprehensive Guide To Networks IoT SS. Use it as a tool for discussion and navigation on Healthcare Analytics, Dashboard Using IoT Technology, Patient Satisfaction. This template is free to edit as deemed fit for your organization. Therefore download it now.
-
Cloud Computing Iot Data Processing Analytics Dashboard PPT Summary VA
Harness the cuttingedge synergy of cloud computing and IoT with our dynamic analytics dashboard PowerPoint template. This expertly crafted summary deck provides a visual storytelling approach to complex data processing allowing you to engage your audience with modern slide designs that highlight key insights. Transform tedious data into compelling visuals with editable slides that facilitate effective decisionmaking and strategy development. Ideal for consulting presentations or corporate pitches this template ensures seamless communication of your analytics narrative. Elevate your presentations with this unique blend of functionality and creativity perfect for any forwardthinking business ready to harness the power of data analytics.
-
Dashboard For IoT Telecommunication Customer Service
This slide provides a customer service dashboard for IoT telecommunications that illustrates the number of issues resolved in multiple services. The major elements are complaint status, monthly retention rate, repurchasing rate, etc.Introducing our Dashboard For IoT Telecommunication Customer Service set of slides. The topics discussed in these slides are Customer Lifetime, Customer Retention, Repurchasing Rate. This is an immediately available PowerPoint presentation that can be conveniently customized. Download it and convince your audience.
-
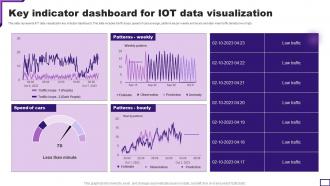
Key Indicator Dashboard For IOT Data Visualization
This slide represents IOT data visualization key indicator dashboard. This slide includes traffic loops, speed of cars average, patterns as per weekly and hourly and date wise traffic density low or high. Introducing our Key Indicator Dashboard For IOT Data Visualization set of slides. The topics discussed in these slides are Key Benefits With Data Visualization In IOT. This is an immediately available PowerPoint presentation that can be conveniently customized. Download it and convince your audience.
-
Dashboard For IoT Water Management Business
This slide provides dashboard for IoT water management. The main purpose of this template is providing insights of IoT water management. This includes monthly consumption, limit consumed, next month forecast ,etc. Introducing our Dashboard For IoT Water Management Business set of slides. The topics discussed in these slides are Monthly Consumption, Limit Consumed, Next Month Forecast. This is an immediately available PowerPoint presentation that can be conveniently customized. Download it and convince your audience.
-
Healthcare Analytics Dashboard Using IoT Technology Guide To Networks For IoT Healthcare IoT SS V
Following slide exhibits dashboard that provides health care data after deployment of internet of things IoT technology. It includes indicators such as patient satisfaction, total patients, average waiting time etc. Present the topic in a bit more detail with this Healthcare Analytics Dashboard Using IoT Technology Guide To Networks For IoT Healthcare IoT SS V. Use it as a tool for discussion and navigation on Healthcare Analytics, Dashboard Using Iot Technology. This template is free to edit as deemed fit for your organization. Therefore download it now.
-
IoT Energy Management Dashboard For Intelligent Buildings IoT Energy Management Solutions IoT SS
This slide exhibits KPI dashboard for facility owners to monitor, optimise and control energy consumption within building environment. It includes elements such as daily electricity consumption, monthly electricity consumption, target, etc. Deliver an outstanding presentation on the topic using this IoT Energy Management Dashboard For Intelligent Buildings IoT Energy Management Solutions IoT SS. Dispense information and present a thorough explanation of Iot Energy Management Dashboard, Intelligent Buildings using the slides given. This template can be altered and personalized to fit your needs. It is also available for immediate download. So grab it now.
-
Healthcare Analytics Dashboard Using IoT Technology IoMT Applications In Medical Industry IoT SS V
Following slide exhibits dashboard that provides health care data after deployment of internet of things IoT technology. It includes indicators such as patient satisfaction, total patients, average waiting time etc. Deliver an outstanding presentation on the topic using this Healthcare Analytics Dashboard Using IoT Technology IoMT Applications In Medical Industry IoT SS V. Dispense information and present a thorough explanation of Overall Patient Satisfaction, Patients By Division using the slides given. This template can be altered and personalized to fit your needs. It is also available for immediate download. So grab it now.
-
IoT In Finance Dashboard For Tracking Assets
This slide showcases real-time status of assets in finance. The main purpose of this template is to highlight outstanding amounts and flow cash in one year. This includes liquid ratio, circulation capital ratio, outstanding sales,etc. Presenting our well structured IoT In Finance Dashboard For Tracking Assets. The topics discussed in this slide are Cash Turnover, Operational Capital. This is an instantly available PowerPoint presentation that can be edited conveniently. Download it right away and captivate your audience.
-
IoT Smart Agriculture Dashboard With Various KPI
The template shows the various KPIs of IoT agriculture. This slide aims to measure the moisture level and speed of the wind to evaluate the best crop for harvesting. It includes KPIs such as moisture of soils, climatic condition, monthly, weekly, etc.Introducing our IoT Smart Agriculture Dashboard With Various KPI set of slides. The topics discussed in these slides are Climatic Condition, Rainfall Level, Moisture Level . This is an immediately available PowerPoint presentation that can be conveniently customized. Download it and convince your audience.
-
Essential Guide To IoT Warehouse Management Dashboard For Inventory Control Ppt Template IoT SS V
The following slide outlines key performance indicator KPI dashboard through which managers can track stock level in real-time. The dashboard covers key metrics such as product view, inventory view, category view, etc. Deliver an outstanding presentation on the topic using this Essential Guide To IoT Warehouse Management Dashboard For Inventory Control Ppt Template IoT SS V. Dispense information and present a thorough explanation of Warehouse Management, Dashboard For Inventory Control, Inventory View, Category View using the slides given. This template can be altered and personalized to fit your needs. It is also available for immediate download. So grab it now.
-
IoT For Smart Banking IoT Data Analytics Dashboard For Smart Bank Branch Ppt Powerpoint IoT SS V
Following slide represents IoT based data analytics dashboard for smart banking branch. It includes parameter such as branch visits, waiting time, financial performance, employee performance, etc. Deliver an outstanding presentation on the topic using this IoT For Smart Banking IoT Data Analytics Dashboard For Smart Bank Branch Ppt Powerpoint IoT SS V. Dispense information and present a thorough explanation of Financial Performance, Employee Performance, Performance Vs Targets using the slides given. This template can be altered and personalized to fit your needs. It is also available for immediate download. So grab it now.
-
IoT Device Management Dashboard Agricultural IoT Device Management To Monitor Crops IoT SS V
This slide showcases a device management dashboard that allows monitoring device status in order to analyze performance. It includes elements such as unique devices, event type, active devices, and total number of events. Present the topic in a bit more detail with this IoT Device Management Dashboard Agricultural IoT Device Management To Monitor Crops IoT SS V. Use it as a tool for discussion and navigation on IoT Device, Management Dashboard, Automotive Industry. This template is free to edit as deemed fit for your organization. Therefore download it now.