

Mexico country powerpoint maps





Try Before you Buy Download Free Sample Product
 Impress Your
Audience
 100%
Editable
 Save Hours
of Time


Paint a pretty picture for your audience. Describe it in detail with our Mexico Country Powerpoint Maps.
People who downloaded this PowerPoint presentation also viewed the following :
Content of this Powerpoint Presentation
Slide 1: This slide introduces MEXICO MAP.
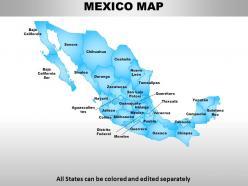
Slide 2: This slide presents MEXICO MAP. All states can be colored and edit separatly.
Slide 3: This slide showcases MEXICO.
Slide 4: This slide presents MEXICO MAP. All States can be colored and edited separately
Slide 5: This slide showcases MEXICO MAP. All States can be colored and edited separately.
Slide 6: This slide presents MEXICO MAP. All States can be colored and edited separately
Slide 7: This slide showcases MEXICO MAP with the durango. All States can be colored and edited separately.
Slide 8: This slide presents MEXICO MAP. All States can be colored and edited separately and these three are highlighted. Sonora, Oaxaca, Chiapas.
Slide 9: This slide showcases MEXICO MAP. All States can be colored and edited separately.
Slide 10: This slide showcases MEXICO MAP. All States can be colored and edited separately.
Slide 11: This slide shows MEXICO MAP. All States can be colored and edited separately
Slide 12: This slide presents MEXICO MAP.
Slide 13: This slide shows MEXICO MAP with these of the following- Sonora, Coahuila, Guerrero, Chiapas, All States can be colored and edited separately.
Slide 14: This slide shows MEXICO MAP with these of the following- Chihuahua, Tamaulipas, Oaxaca, Campeche, All States can be colored and edited separately
Slide 15: This slide presents MEXICO MAP with these of the following- Chihuahua, Tamaulipas, Oaxaca, Campeche, Jalisco, All States can be colored and edited separately
Slide 16: This slide shows mexico map.
Slide 17: This slide presents MEXICO MAP.
Slide 18: This slide shows Use these icons in your map.
Slide 19: This slide presents Use these icons in your map.
Slide 20: This slide showcases Use these icons in your map.
Slide 21: This slide shows MEXICO MAP. All States can be colored and edited separately
Slide 22: This slide presents MEXICO MAP. All States can be colored and edited separately
Slide 23: This slide presents MEXICO MAP. All States can be colored and edited separately
Slide 24: This slide presents MEXICO MAP which further showcases sonora ,duranga, nuevoleon,micheacan,oaxaca.
Slide 25: This slide shows MEXICO MAP which further presents Chihuahua. All States can be colored and edited separately.
Slide 26: This slide presents MEXICO MAP which further showcases coahullia.
Slide 27: This slide shows MEXICO MAP which states Durango.
Slide 28: This slide presents MEXICO MAP which further showcases which further presents Tamaulipas.
Slide 29: This slide shows MEXICO MAP. All States can be colored and edited separately.
Slide 30: This slide presents MEXICO MAP which further shows- Baja California, Baja California Sur, Sonora, Chihuahua, Sinaloa, Durango, Coahuila, Nuevo León, Tamaulipas, Zacatecas, Nayarit, Jalisco, Colima, Michoacán, Guerrero, Oaxaca, Chiapas, Tabasco, Campeche, Quintana Roo, Yucatán, Veracruz, Puebla, Morelos, Distrito Federal, Tlaxcala, Mexico, Hidalgo, Guanajuato, Querétaro, San Luis Potosí, Aguascalientes, All States can be colored and edited separately
Slide 31: This slide presents MEXICO MAP which further showcases Durango. All States can be colored and edited separately.
Slide 32: All States can be colored and edited separately with sinaloa and yucatin. This slide presents MEXICO MAP.
Slide 33: This slide shows All States can be colored and edited separately.
Slide 34: This slide shows MEXICO MAP.
Slide 35: This slide presents MEXICO MAP which further showcases COAHUILA Saltillo.
Slide 36: This slide shows MEXICO MAP which further showcases NUEVO LEÓN.
Slide 37: This slide presents MEXICO MAP which further presents TAMAULIPAS.
Slide 38: This slide shows MEXICO MAP which further showcases SAN LUIS POTOSÍ
Slide 39: This slide presents MEXICO MAP which presents GUANAJUATO.
Slide 40: This slide presents MEXICO MAP with these of the following CHIHUAHUA.
Slide 41: This slide showcases MEXICO MAP which further presents DURANGO.
Slide 42: This slide presents MEXICO MAP. All States can be colored and edited separately.
Slide 43: This slide showcases MEXICO MAP which showcases ZACATECAS.
Slide 44: This slide shows MEXICO MAP which further presents GUERRERO.
Slide 45: This slide presents MEXICO MAP which further showcases PUEBLA.
Slide 46: This slide presents MEXICO MAP.
Slide 47: This slide showcases Focus on Durango. All States can be colored and edited separately.
Slide 48: This slide presents Focus on Tamaulipas. All States can be colored and edited separately .
Slide 49: This slide shows Focus on Sinaloa. All States can be colored and edited separately.
Slide 50: This slide presents Focus on Michoacán. All States can be colored and edited separately.
Slide 51: All States can be colored and edited separately which further Focus on Chihuahua.
Slide 52: This slide presents MEXICO MAP which further presents Sales Targets and Projections.
Slide 53: This slide showcases MEXICO MAP which further presents Sales Targets and Projections.
Slide 54: This slide presents MEXICO MAP. All States can be colored and edited separately
Slide 55: This slide shows MEXICO MAP.
Slide 56: This slide presents MEXICO MAP which further presents Sales Representatives.
Slide 57: This slide shows Edit Color– Inside the Group which further presents- Right click the object, Choose Group and then Ungroup, Click beside the object and drag the arrow over it.
Slide 58: This slide shows how to Edit Color.
Slide 59: This slide presents Edit size.
Slide 60: This slide presents Insert names using text boxes.
Mexico country powerpoint maps with all 60 slides:
Slip in to the role with ease. Our Mexico Country Powerpoint Maps will give the right cues.


FAQs for Mexico
Dude, Mexican maps are honestly wild when you look at the changes over time. Start with the massive Aztec territories, then watch Spanish colonial borders creep in from the 1500s. The craziest part? Mexico kept getting smaller - they lost SO much land to the US after that 1848 war. Independence in 1821 jumps out pretty clearly too. Oh, and there's that weird French period in the 1860s I always forget about. Definitely compare before/after maps around major wars - that's where you'll see the real drama unfold.
Dude, Mexican topo maps are actually pretty sweet for showing all that crazy terrain. The contour lines get super tight around the Sierra Madre ranges - like, ridiculously packed together. Coastal areas? Way more spread out. Colors help too - browns and whites mark the high volcanic stuff, greens show valleys, blue's obviously the coastlines on both sides. You can see how it drops from 18,000+ feet down to beaches. Honestly, grab one before doing any fieldwork there. I learned that the hard way - totally underestimated how long it'd take getting between regions.
Honestly, digital maps are a game-changer for tracking Mexico's urban sprawl. You can watch cities like Mexico City and Guadalajara expand in real-time, which is pretty wild. The satellite updates come through super frequently now too. What's cool is layering different data - you'll spot housing patterns, infrastructure gaps, and population shifts you'd never catch otherwise. Urban planners use this stuff to figure out where new transit lines should go or which areas need more green space. Oh, and it tracks informal settlements growing too. I'd start with Google Earth Engine or check out INEGI's tools if you want to dive deeper into specific patterns.
Oh dude, thematic maps are perfect for this! Map out stuff like population density, where indigenous languages are spoken, migration patterns - suddenly you'll see all these crazy connections. The border cities pop out immediately with their urbanization. Southern states show these clear indigenous clusters. Economic data reveals which regions are thriving vs struggling. Honestly, I got lost in these maps for hours last semester. Layer different datasets on top of each other - that's when the real "aha moments" happen. Way better than staring at boring spreadsheets trying to find patterns that don't jump out.
So the old Mexican maps are gorgeous but kinda all over the place accuracy-wise - lots of fancy compass roses and religious symbols from the Spanish colonial days. Modern ones are totally different. GPS and satellite data make them super precise, but honestly they're way less interesting to look at. Color-wise, the historical ones used these beautiful earth tones while today's maps stick to boring standardized colors for roads and elevation. Oh and the audiences were completely different too - old maps were more about impressing people than actually getting you from point A to B. For your project, I'd focus on how that purpose shift changed everything about the design approach.
So tourist maps usually show the big hits - Chichen Itza, Teotihuacan, those gorgeous colonial towns like Guanajuato. Beach spots get huge coverage too. Cancun, Puerto Vallarta, all that. The cenotes in Yucatan are amazing if you're into swimming in underground caves (kinda surreal honestly). Mexico City's historic center is always featured big since most people fly in there anyway. Copper Canyon's stunning but way less crowded than the other spots. Maps tend to group stuff by region which actually helps with planning routes. I'd grab a country-wide one plus detailed regional maps for wherever you're spending most time.
Dude, Mexico's borders are wild when you look at the history. The Mexican-American War in 1848 was brutal - they lost like half their territory to the US through the Treaty of Guadalupe Hidalgo. That northern border you see? That's where it all went down. The Rio Grande thing with Texas happened even earlier during their revolution. I swear, comparing old maps to current ones is crazy - such a massive difference. Guatemala and Belize borders shifted around too from various 19th century treaties. Definitely check pre-1848 maps if you're doing anything historical, it'll blow your mind.
So Mexico maps these days use satellite stuff like Landsat and Sentinel, plus GPS surveying and LiDAR for the terrain details. Most interactive ones run on ArcGIS, QGIS, or web tools like Mapbox. INEGI is Mexico's stats institute - they're your best bet for official data on boundaries and infrastructure. Drones are becoming really popular for smaller area mapping too, which makes sense. If you want to make your own maps, I'd definitely hit up INEGI's open data portal first. Way easier than starting from scratch.
Honestly, those "label the states" worksheets are such a snore - I hated them too. Try having kids trace actual trade routes or mark cities they'd actually want to visit. Gets them way more engaged. Thematic maps work great too - climate zones, indigenous languages, that kind of stuff. Digital maps are clutch because they can zoom into specific areas and dig deeper. My cousin's a teacher and swears by having students make their own maps showing economic activities. The whole point is getting them to actually DO something with the data instead of just memorizing random locations. Start small with one activity and see what happens!
Look at GDP per capita and poverty rates first - those give you the clearest picture of Mexico's north-south divide. Unemployment data helps too. Industrial output and foreign investment are heavily concentrated around border states and big cities, which is pretty wild when you see it mapped out. Wage differences, banking access, and education levels all tell the same story basically. The patterns are super consistent no matter which indicator you pick. I'd honestly start with those GDP and poverty maps since they're straightforward, then layer in the other stuff once you get the baseline geography down.
So Mexican maps used to be totally messed up - Spanish colonizers basically erased indigenous lands on purpose, then 20th century government maps just called everything "rural areas." Such BS. Things started changing in the '90s though when indigenous communities began making their own maps. Now there are actually detailed maps of all 68 recognized territories showing real boundaries, sacred sites, resources - the whole deal. Oh and INEGI has some solid indigenous mapping projects if you need sources. Way better than the old colonial garbage.
Mexico's water sources are everywhere on maps because they're literally lifelines for farming, cities, and industry. The Rio Grande marks the whole US border. Colorado River feeds northwest agriculture. Big lakes like Chapala get tons of detail since entire economies depend on them - honestly, it's wild how Mexico has both desert regions and lush tropical coasts. Blue coding on topographic maps shows permanent versus seasonal water, which explains a lot about why certain areas developed the way they did. Always check water-to-land ratios when you're looking at regional maps.
Dude, those climate maps are actually super useful for Mexico stuff. Northern areas like Sonora get absolutely hammered by drought and crazy heat - it's brutal up there. Meanwhile the south deals with flooding and hurricanes during rainy season. You'll see such wild temperature differences between the desert zones and highland regions too. Honestly, it makes total sense why certain areas can't grow specific crops or have water issues. The maps basically show you where each region's biggest problems are gonna hit. Definitely check them out before planning anything there - could save you from some nasty surprises.
Definitely check out the Library of Congress digital collection first - their search is super easy to use and they've got tons of historical Mexico maps. The David Rumsey collection is amazing too, especially for 18th/19th century stuff (I get lost browsing that site for hours honestly). For academic research, University of Texas Austin's Perry-Castañeda Library has great high-res downloads. Harvard's online map portal is solid too. I'd start with Library of Congress since it's the most user-friendly, then hit up the others depending on what time period you need.
Maps are basically your best friend for cultural tourism in Mexico - they help you find all those hidden archaeological sites and indigenous villages you'd totally miss otherwise. Heritage maps now show stuff like the Mayan Route and colonial architecture trails with actual cultural backstory, not just directions. Honestly, they're more like storytelling tools at this point. Most include QR codes for historical info and audio guides too. Oh, and if you're doing heritage tourism work? Digital layered maps are where it's at - you can show both the physical routes and all the cultural stories behind each spot. Way more engaging than regular tourist maps.
-
Informative design.
-
Very unique, user-friendly presentation interface.