


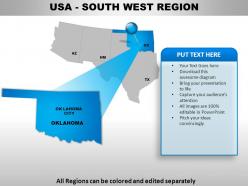
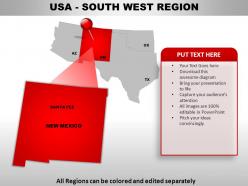
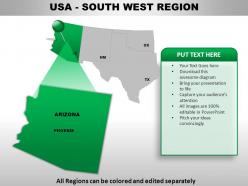
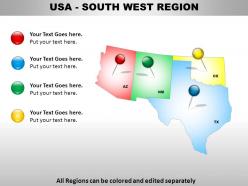
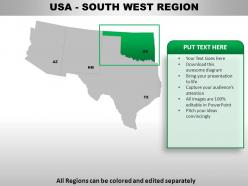
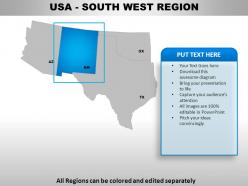
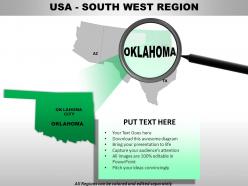
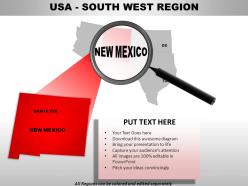
Usa south west region country powerpoint maps





Try Before you Buy Download Free Sample Product
 Impress Your
 Audience
 100%
100% Editable
 Save Hours
 of Time


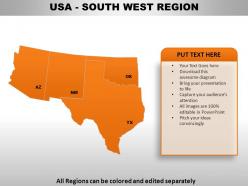
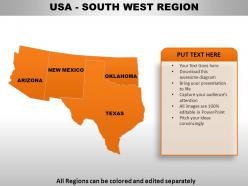
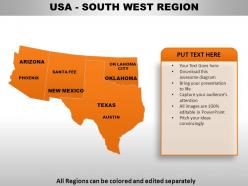
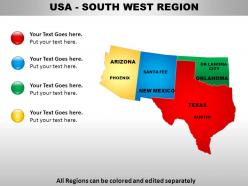
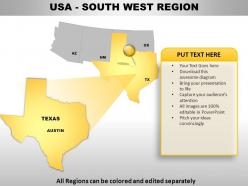
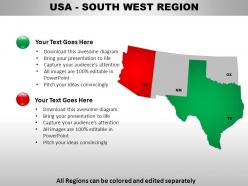
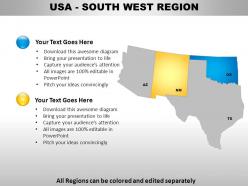
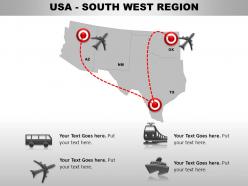
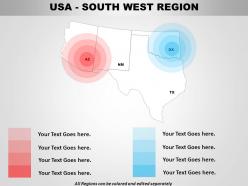
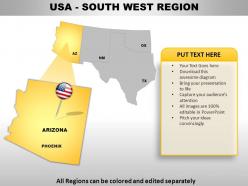
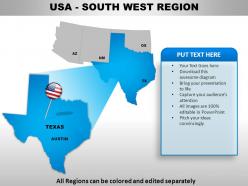
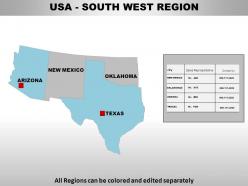
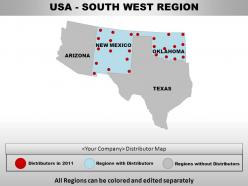
Certify your growth with our USA South West Region Country Powerpoint Maps. Amplify on your vision with their help.
People who downloaded this PowerPoint presentation also viewed the following :
Usa south west region country powerpoint maps with all 28 slides:
You know you have a discerning audience. Appeal to their intellect with our USA South West Region Country Powerpoint Maps.

FAQs for Usa south west region
Honestly, the elevation changes out there are insane - huge canyons, mountain ranges, desert basins all crammed together. Look for those clustered contour lines around the Grand Canyon and Rockies. The desert parts actually have way more ups and downs than you'd think, which surprised me when I first started looking at these maps. Colorado River basically carved massive channels everywhere. Oh, and definitely check those contour intervals because the elevation swings are brutal - they'll mess with your hiking plans and the weather gets weird with all those changes.
Yeah, cultural landmarks totally drive how Southwest maps get designed! Mapmakers always throw in places like Mesa Verde and Canyon de Chelly first because that's what people actually use to get around. Makes sense, right? Those spots aren't just pretty geology - they've got like centuries of Native American and Hispanic history baked in. I'd probably start with the cultural stuff too if I was making maps there. Way more meaningful than some random mountain peak nobody cares about. Tourists and locals both navigate using these familiar anchors anyway.
Dude, geological stuff is literally what makes Southwest maps work. Grand Canyon, Monument Valley - those aren't just tourist traps, they're how people actually navigate out there. The rock formations determine where roads can go, elevation changes, water sources, all that practical stuff. Honestly, I think half the appeal of the region is those insane rock structures anyway. Monument Valley still blows my mind every time I see photos. But yeah, if you're making maps for that area, nail the geology first. Everything else - tourism, local navigation - depends on getting those formations right.
Dude, historical maps are like time travel for infrastructure nerds. Compare maps from different decades and you'll watch railroad networks spread out, highways get built, water projects appear. Towns literally popped up wherever trains stopped or water flowed - it's wild. Route 66 shows up in 1930s maps, then interstate planning hits the 1950s versions. Mining ops and dams totally shaped where people settled too. USGS has tons of old maps online, or check state archives. Honestly way more addictive than you'd think once you start digging through them.
Definitely get USGS 7.5-minute topo maps - they're the best for Southwest hiking. You'll need those elevation details and water sources marked out, especially with how crazy desert terrain can be. National Geographic Trails Illustrated ones are solid too since they mark the popular trails and camping areas. I'm old school about this, but always bring paper backups even if you've got GPS apps downloaded offline. Your phone will die at the worst possible moment, trust me. Cell service is garbage out there anyway. Just double-check the map dates before you go - desert trails change fast after storms and stuff.
So Southwest cities like Phoenix and Vegas have this really interesting pattern on population maps. Dense clusters around the old downtowns, then it just drops off fast into sprawling suburbs. These places grew outward instead of up, which honestly makes sense given all that available desert land. You can literally see where the city ends and empty desert begins - it's such a sharp contrast! The maps are super useful for figuring out where infrastructure money went and predicting which areas will boom next. Perfect for planning stuff.
Dude, interactive maps are a total lifesaver for Southwest trips. Static maps make everything look close together, but Arizona's freaking huge - Grand Canyon to Antelope Canyon is 2.5 hours! You can layer stuff like trail difficulty and weather conditions, which honestly saved my butt when I almost hiked into a thunderstorm last year. Save your routes and share them with whoever you're traveling with. Most important thing though? Use them to group attractions by area. Trust me, you don't want to be driving back and forth across Utah like I did.
Honestly, water is everything when you're looking at Southwest maps. Cities like Phoenix and Vegas didn't just randomly pop up - they're all built around rivers or groundwater. The Colorado River is basically the lifeline for half the region, which is crazy when you think about it. Check out any map and you'll see highways, farms, and neighborhoods all following the water sources. That's your first clue for understanding why stuff is where it is. Without water, the Southwest would just be empty desert with maybe a gas station here and there.
Dude, thematic maps are perfect for the Southwest's environmental mess. They show water scarcity patterns, drought zones, and how fast we're draining aquifers - honestly kind of terrifying when you see it all mapped out. Wildfire risk areas pop right out too. Phoenix and LA air quality issues become super obvious. Plus you can spot biodiversity hotspots that desperately need protecting. The water data hits different though - way more alarming than reading stats. Check out USGS and EPA's interactive ones if you're doing any environmental work. You can layer different datasets and catch connections you'd totally miss otherwise.
So state maps give you the broad view - highways, cities, county boundaries across whole states like Arizona or Utah. Park maps are totally different though. They zoom into specific areas with crazy detail about trails, campgrounds, visitor centers, all that stuff. The difference is honestly huge when you see them together. For road trips and getting around, state maps work great. But once you're actually hiking? You need those park-specific ones. I learned this the hard way in Zion last year. Definitely grab both if you're doing any serious Southwest exploring.
Hey! So for Southwest maps, I'd start with the big physical stuff - Colorado River, Rio Grande, Grand Canyon, all those desert areas. Then add the cities and trade routes on top. Honestly, elevation maps are perfect for this region because the terrain is just insane. Your students could trace how rivers shaped where people settled, then compare old maps with current ones to see border changes (especially that Mexico-US line - so much history there). Oh, and having them make their own annotated maps works great too. They can mark Native territories, mining spots, national parks, whatever you're focusing on. Gets them actually engaged instead of just staring at a textbook.
Dude, LiDAR and satellite imagery are totally changing the game for Southwest mapping. The terrain detail is insane - every canyon and mesa shows up crystal clear. Drones are also massive right now, way cheaper than old-school aerial surveys. Perfect for all those crazy remote spots out there (and trust me, there's a ton of them). Machine learning's pretty cool too, automatically picking out geological stuff and vegetation patterns. Honestly, if you're doing any Southwest projects, definitely check out LiDAR datasets. The topographic analysis you'll get is just nuts.
Dude, satellite images are seriously clutch for mapping the Southwest - way better than I expected when I first started looking into this stuff. Traditional maps show you roads and boundaries, sure. But satellites? They catch all the real-time changes happening out there. Phoenix sprawl, drought hitting water sources, new construction popping up in random desert spots. The detail is honestly insane now. You can literally spot flash flood damage and seasonal shifts in vegetation. I've even heard border patrol uses them to track illegal crossings, which makes sense. Mix satellite data with regular maps and you'll get the full picture of what's actually going down.
Honestly, the variety is insane - desert scrub literally next to alpine forests within a few miles of elevation change. Boundaries are a nightmare since ecosystems blend gradually instead of having clean edges. Seasonal stuff makes it worse too (monsoon season changes everything). Remote sensing helps but you absolutely need ground-truthing because satellites miss subtle vegetation differences that actually matter. Oh, and start with elevation data - best predictor you'll get for ecosystem transitions. The gradual blending thing will drive you crazy at first.
Maps in the Southwest are finally getting better at showing indigenous perspectives. Tribes are working with cartographers to add Native place names, traditional territories, and sacred sites that old maps totally ignored. You'll see both English and tribal language names now, plus traditional trade routes. About time honestly - maps have been way too colonizer-focused for centuries. Modern mapmakers include seasonal migration patterns and ceremonial locations too. Oh and if you're doing any mapping work out there, definitely hit up local tribal cultural offices first instead of just using federal data. Way more accurate that way.
-
Understandable and informative presentation.
-
Appreciate the research and its presentable format.