


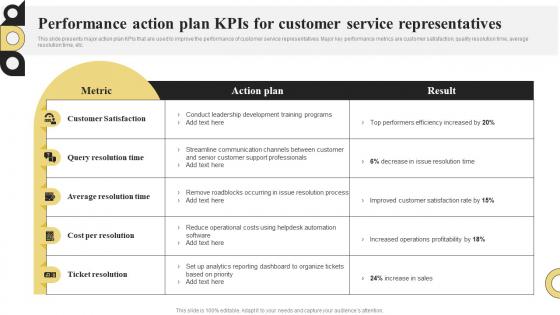
Performance Action Plan KPIs For Customer Service Representatives




Try Before you Buy Download Free Sample Product
 Impress Your
 Audience
 100%
100% Editable
 Save Hours
 of Time


This slide presents major action plan KPIs that are used to improve the performance of customer service representatives. Major key performance metrics are customer satisfaction, quality resolution time, average resolution time, etc.
People who downloaded this PowerPoint presentation also viewed the following :
Performance Action Plan KPIs For Customer Service Representatives with all 6 slides:
Use our Performance Action Plan KPIs For Customer Service Representatives to effectively help you save your valuable time. They are readymade to fit into any presentation structure.





FAQs for Performance Action Plan KPIs For
Honestly, it totally depends on what kind of business you're running. Retail folks care about conversion rates, average order value, customer lifetime value - the usual money stuff. SaaS companies are obsessed with monthly recurring revenue and churn rates (probably because losing customers hurts so much). Manufacturing is all about equipment effectiveness and defect rates. Healthcare tracks patient satisfaction and readmission rates. Each industry has its own thing, you know? But here's what I'd do - figure out what actually moves the needle on your revenue and customer happiness first. Then build your dashboard around those core numbers instead of tracking everything under the sun.
Pick 3-4 KPIs max that actually connect to what your team's trying to accomplish. More than that and you'll get lost in the weeds - trust me on this one. Mix leading indicators (activity stuff) with lagging ones (actual results) so you can pivot before it's too late. I used to track like 12 different metrics and it was a nightmare figuring out what mattered. Your team needs to get why each KPI exists and how it affects them personally. Weekly check-ins work great, or just throw together a simple dashboard. The real trick is staying consistent with reviews and tweaking targets as you go.
So basically, leading indicators show you what's coming next - like your crystal ball for performance. Lagging indicators? That's what already went down, like last quarter's revenue or those customer surveys. Picture driving - you're looking ahead through the windshield (that's your pipeline data, market shifts) but also glancing at the rearview mirror to see where you've been. Honestly, most people just obsess over the lagging stuff and then wonder why they can't pivot fast enough. You really need both though. Find leading indicators that actually predict your big wins, then balance them with your results tracking. That's how you catch problems before they wreck everything.
Honestly, just trace each KPI back to your main goals - if there's no obvious connection, toss it. Most teams I've worked with track way too much random stuff that doesn't matter. Stick to maybe 3-5 metrics that actually impact what you're trying to accomplish. You want everything flowing from your big picture strategy down to individual performance. Here's the thing - before tracking anything, ask yourself "if this number improves, will it help us hit our priorities?" No? Then don't waste your time on it. Sounds obvious but you'd be surprised how often people miss this.
Honestly, there's a bunch of good options out there. Google Analytics is pretty much the standard for website stuff. Tableau and Power BI are solid if you want fancy visual dashboards pulling from different places. But real talk – sometimes Excel or Google Sheets does the job just fine, we tend to overthink this stuff. Monday.com is decent too, along with Klipfolio and Databox for business metrics. The main thing? Pick whatever your team will actually stick with. I've seen people get the expensive tools then never touch them. Start basic, then upgrade when you hit limitations.
First thing - make sure your KPIs actually connect to goals your team can control. Like, if the number changes, can you guys DO something about it? Tracking vanity metrics is honestly just soul-crushing. The metrics need to be measurable without crazy data gymnastics, timely enough for quick pivots, and matter to whoever's making decisions. Here's my test: "what would we do differently if this went up or down 20%?" Can't answer that clearly? Wrong KPI. Also maybe grab metrics from different timeframes - some daily stuff, some monthly. You'll catch problems faster that way.
Here's my take: keep it to 3-5 indicators max or you'll just get overwhelmed by all the data. Skip the vanity metrics that look cool but don't actually help you make decisions - like obsessing over page views when conversion rate is what really matters. I've watched teams get totally sucked into tracking stuff that has literally zero connection to their goals, which is such a waste of time honestly. Pick metrics you can actually do something about and that tie directly to business results. Otherwise you're just staring at random numbers going up and down.
Check your performance metrics monthly if possible - quarterly at the absolute minimum. Things change way too fast to let your KPIs collect dust for six months. I've watched teams obsess over numbers that stopped mattering ages ago, which is honestly just painful to see. Monthly reviews help you catch when metrics drift from reality. Put a recurring meeting on your calendar specifically for this. Market shifts happen, priorities change, strategies pivot. Short bursts work better than marathon sessions anyway. If a metric feels useless or disconnected from what you're actually trying to achieve, ditch it right away.
Honestly, regular pulse surveys work way better than waiting for annual reviews. Do 360-degree feedback sessions and tie them to your actual KPIs. Ask employees if goals feel realistic and what's blocking them - the "why" behind your data matters more than you'd think. Numbers alone are pretty useless without context. Monthly check-ins where you review both data AND their input together are clutch. Oh, and let them suggest metrics that actually relate to their daily work. Makes the whole thing feel less top-down, you know?
Dude, real-time data is a total game-changer for tracking your KPIs. Instead of finding out about problems weeks later, you can actually catch stuff as it's happening. Your dashboards show what's going on right now, not some stale info from last month. Makes decision-making so much faster too - no more waiting around for quarterly reports. I'd say start with KPIs around customer experience or operations, those usually benefit the most from instant monitoring. Honestly beats the hell out of playing catch-up all the time.
Okay so first thing - figure out who you're talking to. Executives just want the big picture stuff, but team leads need all the nitty-gritty details. Charts and dashboards are your best friend here because honestly, no one's reading through spreadsheets anymore. Always explain what the numbers actually mean for their goals and what they should do about it. That's the part people care about most. Don't dump everything at once - send updates regularly instead. Oh, and definitely make time for follow-up questions. Performance data usually creates more questions than answers, so you'll probably get pulled into a few conversations afterward.
Honestly, less is more with these things. Focus on showing trends instead of jamming everything onto one slide. Bar charts for comparing stuff, line charts when you want to show change over time. Executives? They'd rather see one big number with good context than some overcomplicated dashboard (though they'll never admit it). Keep your colors and scales the same throughout so people aren't confused. Most importantly - don't just say "sales dropped 15%" and leave everyone hanging. Tell them what you're actually gonna do about it. Start with whatever metric matters most and build from there.
Ok so basically quantitative = actual numbers you can track, like sales or conversion rates. Qualitative is more the fuzzy stuff - how people *feel* about your brand, employee happiness, that kind of thing. I used to think qualitative was less important (probably because I'm a numbers person), but honestly both matter. Numbers tell you what's happening, but the other stuff explains why. Like if your retention rate drops, customer feedback might show it's because your new update sucks. You'll want some of each when you're tracking performance. Just don't go overboard - I've seen people track literally everything and it gets overwhelming fast.
Hey! So for benchmarking, I'd start with industry reports from McKinsey or Deloitte - they're usually pretty solid. Trade association surveys work too. You can also dig into competitors' public financials, though that gets tedious fast. APQC offers benchmarking services but honestly, they're expensive. Industry conferences are where the real gold is - you'll get way more honest insights chatting with people over drinks than from any formal report. Pick 3-5 similar companies and compare stuff like revenue per employee or customer acquisition costs. Whatever matters for your business. Just don't try doing everything at once - pick one approach first.
So first thing - put those metrics where everyone can actually see them. Dashboards, weekly updates, whatever. I've worked places where they had all this data but kept it locked away like some secret, which is honestly ridiculous. Connect the numbers directly to what people are supposed to be doing. Then do regular check-ins where you actually talk about the progress. Someone's killing it? Shout them out publicly. They're falling behind? Jump in with help, not judgment. The whole point is making this stuff part of normal conversations instead of saving it all for year-end reviews.
-
Very unique and reliable designs.
-
Incredibly beautiful designs that will help you get noticed! These eye-catching templates are perfect for corporate presentations that can be altered to fit any occasion or taste.