-
 0514 ladder to reach goal image graphics for powerpoint
Professionally designed Presentation slides. Impressive visual representation on wide screen without any blurriness. Fully adjustable with Google slides. Compatible with multiple software options available both online and offline. Ease of inclusion and exclusion of content as per individual need. Can be saved easily in any format JPEG or PDF. Suitable for business and corporate leaders and professionals. Personalize the presentation with company name and logo.
-
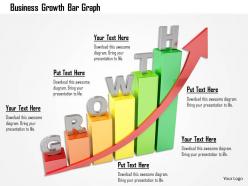 Business growth bar graph image graphics for powerpoint
Perfect presentation template worthwhile in saving time and energy. Choice to customize PowerPoint slide text as per your trade requirement. Alternate to personalize the presentation layout with business sign and brand name. Totally alterable design as changes can be done with color, text and shape. Entirely compatible with Google slides. Adaptable PPT design as can be converted into JPEG and PDF.
-
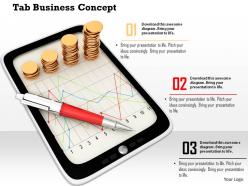 0914 tablet business concept graphs gold coins pen ppt slide image graphics for powerpoint
We are proud to present our 0914 tablet business concept graphs gold coins pen ppt slide image graphics for powerpoint. This exclusive image has been designed with graphic of tablet and stacks of gold coins with pen. This image displays the concept of trade and growth of gold. It also explains the concept of daily update of financial growth and stock update. Use this image for business and sales related presentations.
-
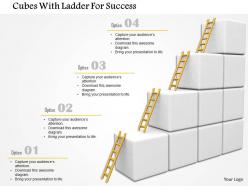 Cubes with ladder for success image graphics for powerpoint
We are proud to present our cubes with ladder for success image graphics for powerpoint. Graphic of cubes with ladder has been used to design this power point template. This image slide contains the concept of success. Use this image slide for business and marketing related presentations.
-
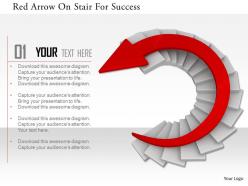 0115 red arrow on stair for success image graphics for powerpoint
Easy proofing and editing is added on feature of presentation visual. Presentation slide is useful in business marketing, management and recourse disbursement. Basic theme yet it can modified with respect to font, color and layout. Attractive color scheme gives a professional look to PPT layout. Conversion into PDF or JPG formats is very easy and handy. PPT graphic offers font size which can be read from a distance.
-
 Books and ladder with goal achievement image graphics for powerpoint
Comfort of changing presentation colors, shades and alignment. Right to personalize it with business name and emblem. Ease of including and excluding contents as per the business requirement. High resolution with exceptional picture quality. PowerPoint designs well-harmonized with Google slides. Prompt download and simple to share. Pixels don’t break even when shared in widescreen view. Valuable for business administrators, professionals, students, professors, education units etc.
-
 0914 arrow jumping over hurdles image graphics for powerpoint
We are proud to present our 0914 arrow jumping over hurdles image graphics for powerpoint. This image slide displays arrows jumping over hurdles. This image slide may be used in your presentations to depict growth, challenges, solutions, achievements and success. This image slide may also be used in games presentations. Give new look to your presentations by using this image slide.
-
 1114 2015 year with arrow growth graph image graphics for powerpoint
We are proud to present our 1114 2015 year with arrow growth graph image graphics for powerpoint. This Power Point image template slide has been crafted with graphic of 2015 year text and arrow. This PPT slide contains the concept of business growth and success. Use this image template and get good remarks from your viewers.
-
 1114 business graph of two thousand fifteen image graphics for powerpoint
We are proud to present our 1114 business graph of two thousand fifteen image graphics for powerpoint. This Business Power Point image template has been designed with graphic of bar graph of 2015 year text. This image template contains the concept of new year planning. This image slide can be used for business and finance related presentations.
-
 0514 presentation charts and graphs image graphics for powerpoint
We are proud to present our 0514 presentation charts and graphs image graphics for powerpoint. This Business Power Point template is designed with 3d image of chart with ladder to show increase in business result. Use this business power point template in presentations and calculate percentage values.
-
 0814 growth analysis with pie and bar graph on laptop image graphics for powerpoint
We are proud to present our 0814 growth analysis with pie and bar graph on laptop image graphics for powerpoint. This business image has been designed with graphic of bar graph with pie chart and a laptop. This image displays the concept of financial growth analysis which is very important for business and finance related presentations. Use this image for professional presentations.
-
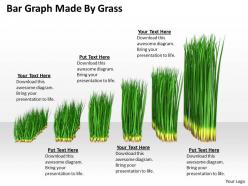 0514 bar graph made by grass image graphics for powerpoint
We are proud to present our 0514 bar graph made by grass image graphics for powerpoint. To show agricultural growth in any power point template ,use this beautiful graphic image template in your presentation and make it more effective .
-
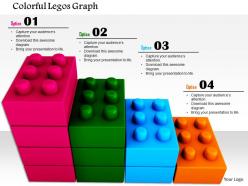 0814 business bar graph made by colored lego blocks image graphics for powerpoint
We are proud to present our 0814 business bar graph made by colored lego blocks image graphics for powerpoint. This image slide displays business bar graph made by colored Lego blocks. This image slide has been designed with colored Lego blocks to form a bar graph. Bar graphs may be used to display a wide variety of information. When data is represented in the form of bar graphs the human eye finds it easy to compare the data and quickly draw conclusions. In short there are great visual aid and will add touch of professionalism to any presentation which requires the display of data.
-
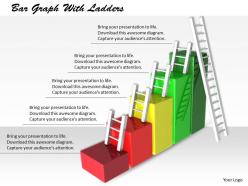 0514 growth ladders on bar graph image graphics for powerpoint
We are proud to present our 0514 growth ladders on bar graph image graphics for powerpoint. This unique graphic template is designed with ladder on bar graph. This bar graph template is can be used for various process display for financial and business growth display.
-
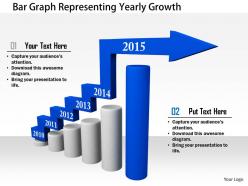 1114 bar graph representing yearly growth image graphics for powerpoint
We are proud to present our 1114 bar graph representing yearly growth image graphics for powerpoint. This Power Point image template slide has been crafted with graphic of bar graph and arrow. This image slide template contains the concept of yearly growth. Use this image slide and build exclusive presentation for your viewers.
-
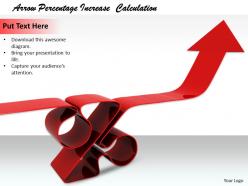 0514 arrow percentage increase calculation image graphics for powerpoint
We are proud to present our 0514 arrow percentage increase calculation image graphics for powerpoint. This Business Power Point template is designed with 3d image of red arrow to show increase in business result. Use this business power point template in presentations and calculate percentage values.
-
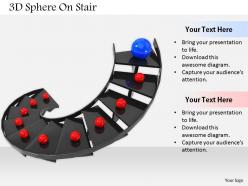 0514 3d stairs for success image graphics for powerpoint
We are proud to present our 0514 3d stairs for success image graphics for powerpoint. This Business Power Point template is designed with 3d colored graphic of stairs for success in any business. Use this business power point template in presentations and enhance your views.
-
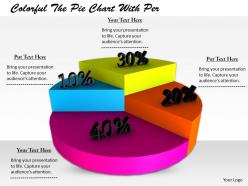 0514 profit percentage on pie chart image graphics for powerpoint
We are proud to present our 0514 profit percentage on pie chart image graphics for powerpoint. This Business Power Point template is designed to show the concept of profit percentage on pie chat with suitable graphics. Use this template in your presentation and show the concept in graphical manner.
-
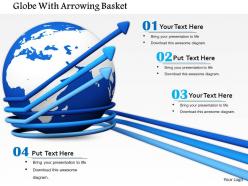 0814 globe covered by multiple arrows shows business image graphics for powerpoint
We are proud to present our 0814 globe covered by multiple arrows shows business image graphics for powerpoint. Graphic of globe has been explained with blue arrows, to display the concept of global communication. We have designed this image to explian global growth and success in any business venture. Create an impact with this quality image and create an unforgettable presentation.
-
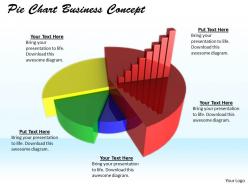 0514 compare business data in pie chart image graphics for powerpoint
We are proud to present our 0514 compare business data in pie chart image graphics for powerpoint. To compare business data use this graphic template in your power point presentation and show the analysis . This template is designed with pie chart graphic to show the business data.
-
 0514 symbol of circle with arrows image graphics for powerpoint
We are proud to present our 0514 symbol of circle with arrows image graphics for powerpoint. This image power point template is designed with 3d graphic of arrows with circle. This template is designed to show any process flow of business and finance. Use this template to enhance the process related concept.
-
 0514 arrows in circle coming out image graphics for powerpoint
We are proud to present our 0514 arrows in circle coming out image graphics for powerpoint. This image power point template is designed with 3d graphic of arrow coming out of circle. This template is designed to show any process flow of business and finance. Use this template to enhance the process related concept.
-
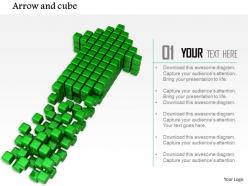 0914 cubes forming arrow growth strategy ppt slide image graphics for powerpoint
We are proud to present our 0914 cubes forming arrow growth strategy ppt slide image graphics for powerpoint. This image display cubes forming arrow for growth. Use this PowerPoint template, in your presentations to express views on growth strategy and different business strategies. This image slide may be used in financial growth, technology and abstraction design related presentations. This image slide will help you make fast, affordable presentations.
-
 0814 pie and xy bar graph with growth arrow for year 2015 image graphics for powerpoint
We are proud to present our 0814 pie and xy bar graph with growth arrow for year 2015 image graphics for powerpoint. This image of Pie and XY bar graph with growth arrow for year 2015 may be used to illustrate the status of year 2015 in terms of business development. This image may be used to display future prospects of a business venture. This image also can be used in presentations relating to business planning.
-
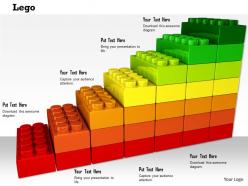 0814 colorful multiple staged lego bar graph for business growth image graphics for powerpoint
We are proud to present our 0814 colorful multiple staged lego bar graph for business growth image graphics for powerpoint. This image slide displays colorful multiple stage Lego bar graph for business growth. This image slide has been made with small colorful 3d Legos connected to form a bar graph. Use this PowerPoint template, in your presentations to display information regarding growth, achievements and success in any business. This image slide will help you make perfect presentations.
-
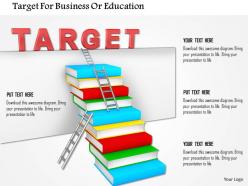 Target for business or education image graphics for powerpoint
We are proud to present our target for business or education image graphics for powerpoint. Concept of target selection has been displayed in this power point image slide. This PPT slide contains the graphic of growth and books. This PPT slide is a good choice for business and education related presentations.
-
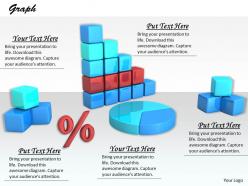 0514 pie and bar graph of business results image graphics for powerpoint
We are proud to present our 0514 pie and bar graph of business results image graphics for powerpoint. This business power point template is designed to show business results . This template is crafted with pie and bar graph to show two different analysis in a same presentation.
-
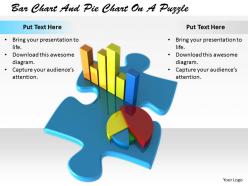 0514 charts for global business trends image graphics for powerpoint
We are proud to present our 0514 charts for global business trends image graphics for powerpoint. This Business Power Point template is designed to show global trends of business. This professional template is designed with 3d graphic of chart. Use this template and enhance the beauty of your presentation.
-
 New beginning of success image graphics for powerpoint
We are proud to present our new beginning of success image graphics for powerpoint. Graphic of human foot prints has been used to craft this power point template slide. This image slide contains the concept of new beginning. Use this image slide for business and success related topics in any presentation.
-
 0514 arrow showing global growth image graphics for powerpoint
We are proud to present our 0514 arrow showing global growth image graphics for powerpoint. This business power point template is designed with red arrow to show global growth. Use this template in financial presentation and show in graphical manner.
-
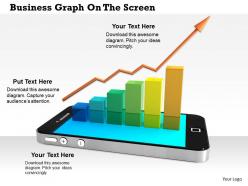 0614 business graph on screen image graphics for powerpoint
We are proud to present our 0614 business graph on screen image graphics for powerpoint. Use this Professional Business Power point template in your presentation, this template is designed with 3d graphic of bar graph. Use this template to display business result and other information.
-
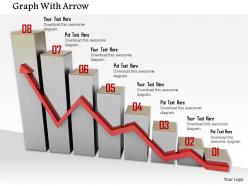 0914 graph with arrow numbers image graphics for powerpoint
We are proud to present our 0914 graph with arrow numbers image graphics for powerpoint. This image slide displays bar graph with growth arrow and numbers. This image slide has been designed with graphic of bar graph bearing red color numbers and growth arrow. Use this image slide, in your presentations to express views on growth, progress, avhievements and success. This image slide will enhance the quality of your presentations.
-
 0514 show the business growth chart image graphics for powerpoint
We are proud to present our 0514 show the business growth chart image graphics for powerpoint. To display the business growth use this Business Power Point template ,which is design with bar graph graphic to display any financial and business growth in presentation.
-
 1014 american flag upward arrow image graphics for powerpoint
We are proud to present our 1014 american flag upward arrow image graphics for powerpoint. Show the growth of US market and marketing strategy with this innovative PPT. This PPT contains the graphic of US flag and upward arrow. Use this PPT for your US business and sales growth related topics.
-
 0914 sales growth chart presenting marketing strategy ppt slide image graphics for powerpoint
Extremely beneficial for the entrepreneurs, investors, clients and the customers. Highly innovative and informative PowerPoint presentation slides. Promising and reliable to display all kinds of information. All the slides are interactive and appealing to the members of the audience. Adds uniqueness to the entire presentation. Experts in delivering a precise message to the viewers.
-
 0914 chairs with table bar graph image slide image graphics for powerpoint
We are proud to present our 0914 chairs with table bar graph image slide image graphics for powerpoint. This image slide displays chairs with table and bar graph graphic. This image slide has been designed with business concept theme. Concepts of growth and management may be explained using this image slide. Use this PowerPoint template, in your presentations to express views on different business strategies. Full fill the goal of making professional presentations using this image.
-
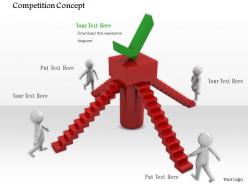 0914 competition concept 3d men tick mark image graphics for powerpoint
We are proud to present our 0914 competition concept 3d men tick mark image graphics for powerpoint. This image slide displays colorful cubes in between grey cubes. This image slide may be used in your presentations to express views on teamwork, leadership, strategies and management. This image slide may also be used to display strategic planning process. This image slide may be used in games presentations. Give your ideas wingds by using this image slide.
-
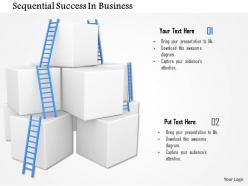 Sequential success in business image graphics for powerpoint
We are proud to present our sequential success in business image graphics for powerpoint. This power point image template slide has been crafted with graphic of ladders. This power point image slide contains the concept sequential success. Use this image slide for business presentations.
-
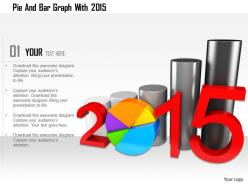 1114 pie and bar graph with 2015 image graphics for powerpoint
We are proud to present our 1114 pie and bar graph with 2015 image graphics for powerpoint. This Power Point image template slide has been crafted with graphic of pie and bar graph and 2015 year text. This PPT slide contains the concept of business and financial analysis. Use this image slide and build quality presentation for your viewers.
-
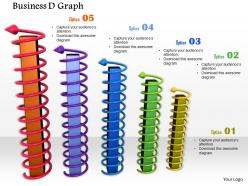 0914 colorful bar graph with arrows image graphics for powerpoint
We are proud to present our 0914 colorful bar graph with arrows image graphics for powerpoint. This image slide displays colorful bar graphs with arrows. This image slide may be used in your presentations to express views on growth, progress and success. This image may be used to represent information which requires visual presentations. Create eye-catching presentations using this image.
-
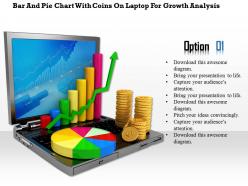 0814 bar and pie chart with coins on laptop for growth analysis image graphics for powerpoint
We are proud to present our 0814 bar and pie chart with coins on laptop for growth analysis image graphics for powerpoint. This image is dedicated for business result analysis. To display the concept of result analysis, use this innovative image. In this image, we have used graphic of bar and pie graph with coins on a laptop. Bar and pie graph are displaying the result analysis and coins are used to display the finance theme. Use this image for business and finance related presentations.
-
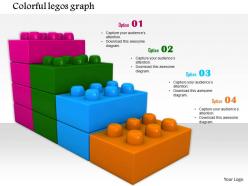 0814 four staged bar graph made by colored lego blocks for growth image graphics for powerpoint
We are proud to present our 0814 four staged bar graph made by colored lego blocks for growth image graphics for powerpoint. This image slide displays four stage bar graph made by colored Lego blocks. This image slide has been made with colorful Lego blocks connected to form bar graph with four stage and text space with it. Bar graph makes it easy to display information and draw conclusions. Use this PowerPoint template, in your presentations to explain concepts related to planning, management, achievements etc. May also be used in game related presentations. This image slide will make your presentations attractive.
-
 0514 see the growth of dollars image graphics for powerpoint
We are proud to present our 0514 see the growth of dollars image graphics for powerpoint. To compete the target of earning dollars is displayed in this Business Power Point template with graphic of target dart and dollar symbol on it. Use this template in your presentation and display the target values to your viewers.
-
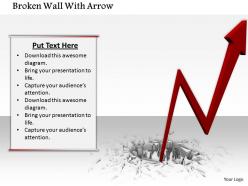 0914 broken wall with arrow growth concept image slide image graphics for powerpoint
We are proud to present our 0914 broken wall with arrow growth concept image slide image graphics for powerpoint. This image slide displays broken wall with arrow. This image slide has been crafted with graphic of broken surface and red color arrow erupting out of it. This image slide is editable and you may change color, size and orientation of icon to your liking. Use this PowerPoint template, in your presentations to express views on growth, success and achievements. This image may also be used to depict market growth in your presentations. This image will impart professional appearance to your presentations.
-
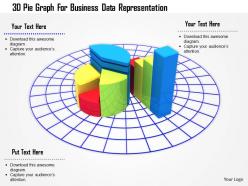 1114 3d pie graph for business data representation image graphics for powerpoint
We are proud to present our 1114 3d pie graph for business data representation image graphics for powerpoint. 3D pie graph has been used to decorate this power point template. This PPT contains the concept of business data manipulation. This template can be used for business and marketing related presentations.
-
 0115 red stair design arrow for success image graphics for powerpoint
We are proud to present our 0115 red stair design arrow for success image graphics for powerpoint. Graphic of red stair design arrow has been used to craft this power point template. This PPT contains the concept of success. Display your success related concepts in any presentation by using this innovative diagram.
-
 0115 three stairs red in middle for leadership image graphics for powerpoint
We are proud to present our 0115 three stairs red in middle for leadership image graphics for powerpoint. This power point template has been crafted with graphic of three stairs, one red stair is in the middle to show the concept of leadership. Use this PPT diagram for business and sales leadership related presentations.
-
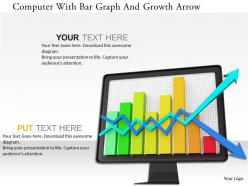 0115 computer with bar graph and growth arrow image graphics for powerpoint
We are proud to present our 0115 computer with bar graph and growth arrow image graphics for powerpoint. Graphic of computer and bar graph with arrows has been used to craft this power point template diagram. This PPT contains the concept of result analysis and growth. Use this PPT for your business and marketing related presentations.
-
 0814 globe with many gold coins for global finance graphics for powerpoint
We are proud to present our 0814 globe with many gold coins for global finance graphics for powerpoint. This symbolic image displays globe with many gold coins. Build a relationship with this amazing image to display concepts like finance, money and economy. Add this image to your presentations to visually support your content.
-
 0614 graph of business transactions image graphics for powerpoint
We are proud to present our 0614 graph of business transactions image graphics for powerpoint. This Business Power Point template is designed with graphic of business transactions. Present your views in unique look and feel with this image slide.
-
 0514 multicolored business bar graph image graphics for powerpoint
We are proud to present our 0514 multicolored business bar graph image graphics for powerpoint. This Business Power Point template is designed with multi-coloured bar graphic. This diagram template is can be used for displaying financial targets in any business related presentation.
-
 0514 display results with grass bar chart image graphics for powerpoint
We are proud to present our 0514 display results with grass bar chart image graphics for powerpoint. This creative masterpiece is designed with graphic of bar graph which is made by grass graphic. This business power point template is designed for agricultural and financial presentations.
-
 Progress represented by golden foot prints image graphics for powerpoint
We are proud to present our progress represented by golden foot prints image graphics for powerpoint. Concept of progress has been displayed in this PPT slide. To show this concept we have used graphic of golden foot prints. Use this image template slide for business and marketing related presentations.
-
 0914 colorful shopping bags shopping concept image slide image graphics for powerpoint
We are proud to present our 0914 colorful shopping bags shopping concept image slide image graphics for powerpoint. This image slide displays the graphic of colorful shopping bags. You may express your opinions related to shopping using this impressive image. Enhance your presentation skills with the use of this image. This image displays the series of shopping bags which may be used to highlight steps and strategies while shopping. Use this PowerPoint template to express views on discounts and marketing. Make attractive presentations using this image slide.
-
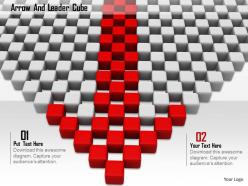 0914 arrow and leader cube image graphics for powerpoint
We are proud to present our 0914 arrow and leader cube image graphics for powerpoint. This image slide displays cubes and red color cubes arrow. Use this image slide, in your presentations to express views on directions, growth and success. This image slide may also be used to depict teamwork, leadership and management. This image slide will help you express your thoughts in a new way.
-
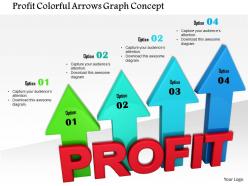 1014 profit colorful arrows graph concept image graphics for powerpoint
We are proud to present our 1014 profit colorful arrows graph concept image graphics for powerpoint. This image contains profit colorful arrows graph. This conceptual image is designed with arrows graph depicting profit growth. Build an innovative presentation for displaying concept of growth and success. Make an impressive presentations by using this image.
-
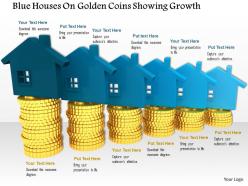 0814 blue houses on golden coins showing growth image graphics for powerpoint
We are proud to present our 0814 blue houses on golden coins showing growth image graphics for powerpoint. This image has been designed with graphic of blue houses on coin stack. This image shows the concept of real-estate growth. Use this image for financial and real estate related presentations. Make your presentation more attractive with this quality image.
-
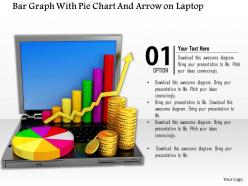 0814 bar graph with pie chart and arrow on laptop image graphics for powerpoint
We are proud to present our 0814 bar graph with pie chart and arrow on laptop image graphics for powerpoint. This professional image has been designed with graphic of bar graph with pie chart and arrow on a laptop. This image displays the concept of financial growth analysis which is very important for business and finance related presentations. Use this image for professional presentations.
-
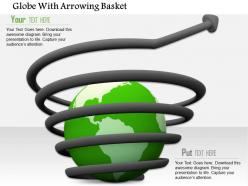 0814 arrow over the globe shows business and marketing image graphics for powerpoint
We are proud to present our 0814 arrow over the globe shows business and marketing image graphics for powerpoint. This image displays graphic of arrow around globe showing upward trend. This image has been designed to depict Global Trade on an Upward Trend. Create an impact with this quality image and make professional presentations.
-
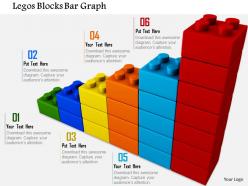 0814 multicolored bar graph made by lego blocks image graphics for powerpoint
We are proud to present our 0814 multicolored bar graph made by lego blocks image graphics for powerpoint. Create dynamic presentations with this professional image containing multicolored bar graph made by Lego Blocks. This image shows the Lego Blocks bar graph which indicates the Chart for Success. This image has been designed to signify the Success, strategy, goal, Competition etc.
Toggle Nav

Skip to Content

Search
5
Notifications 5
-
 SlideTeam has published a new blog titled "Top 7 Center of Excellence PPT Templates with Samples and Examples".
7 hours ago
-
 SlideTeam has published a new blog titled "Top 7 Methodology Chart Templates with Examples and Samples".
7 hours ago
-
 SlideTeam has published a new blog titled "Top 10 Statistical Analysis Templates with Samples and Examples".
7 hours ago
-
 SlideTeam has published a new blog titled "Os 5 principais modelos de orçamento logístico com exemplos e amostras".
7 hours ago
-
 SlideTeam has published a new blog titled "Top 5 des modèles de budget logistique avec exemples et échantillons".
7 hours ago
Growth Powerpoint Graphic and Image Slides. Give your audience a better understanding of business growth with our growth image power point
presentation templates. Every organization sets business goals for themselves for each year which
increase year on year. All the functions and departments of the organization work in harmony with each
other toward achieving them. Such organizations that attain the desired objective are on the path of
success and growth. Our growth templates showcase images of pie charts, bar charts, upward moving
arrows, increasing dollars in size, growth ladders on the bar graph, increasing trend of the business
and many more. Growth is defined in terms of increase in income, profit margins, customer base, and
market share and also increase in the geographical spread of the business. Our Growth templates can
be suitably used as background slides when presenting on performance of the organization, financial
reporting, growth strategies, brand management and market share. Many useful features are provided
by our templates. Such as, you can move and place the image anywhere on the slide. Brightness,
contrast and orientation of the images can also be altered as per your requirement and you can even
choose to add artistic effects to the images. Our Growth image templates are sure to change the mood
of the presentations and make them more appealing and interesting to watch.


