


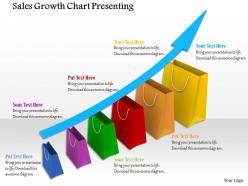
0914 sales growth chart presenting marketing strategy ppt slide image graphics for powerpoint





Try Before you Buy Download Free Sample Product
 Impress Your
Audience
 100%
Editable
 Save Hours
of Time


In order to analyse the performance of your Organisation it is vital to form a Sales progress map and thereafter accordingly strategies can be planned to execute the necessary steps. Therefore, our team has crafted a 0914-sales growth chart Presenting Marketing strategy PowerPoint template Image infographics for PPT presentation. This initiative was taken to provide convenience to the organisations to perform better and to sustain their growth. Apart from this, these presentation layouts can be customised entirely by changing the contents and also by modifying the size, shape and colours of the icons. All this can be done by going through some easy and simple instructions that come pre-defined with these diagrams. Moreover, with a unique design, they impose a powerful impact on the members of the audience. Overall, if you are keen to propose your business and marketing related information accurately to the viewers then without any doubt combine these amazing patterns with your presentations and you are all set to roll. Brilliant backdrops are the essence of our 0914 Sales Growth Chart Presenting Marketing Strategy Ppt Slide Image Graphics For Powerpoint. Guaranteed to illuminate the minds of your audience.
People who downloaded this PowerPoint presentation also viewed the following :
0914 sales growth chart presenting marketing strategy ppt slide image graphics for powerpoint with all 3 slides:
Our 0914 Sales Growth Chart Presenting Marketing Strategy Ppt Slide Image Graphics For Powerpoint are like beautiful gems. Their flashy brilliance will catch every eye.


FAQs for 0914 sales growth chart presenting marketing strategy ppt slide image
Key metrics for sales growth charts include revenue growth rate, conversion rates, average deal size, sales cycle length, and customer acquisition cost. These metrics enable businesses to track performance trends, identify bottlenecks in their sales funnel, and optimize resource allocation, with many organizations finding that comprehensive tracking ultimately delivers enhanced forecasting accuracy and competitive advantage.
Visualizing sales growth impacts decision-making by revealing trends, patterns, and performance gaps that enable strategic planning, resource allocation, and goal setting. Through clear charts and graphs, businesses can identify peak seasons, underperforming products, and growth opportunities, while facilitating faster stakeholder alignment and data-driven decisions that ultimately enhance competitive advantage.
**INPUT**: What tools or software are recommended for creating effective sales growth charts? **OUTPUT**: Recommended tools include Tableau, Power BI, Excel, Google Sheets, Salesforce Analytics, and HubSpot's reporting suite. These platforms streamline data visualization by offering customizable templates, real-time integration, and automated reporting features, with many sales teams finding that interactive dashboards ultimately enhance decision-making speed and strategic forecasting accuracy.
Businesses should update their sales growth charts monthly or quarterly, depending on sales cycle length, market volatility, and strategic planning needs. Companies with shorter sales cycles, like retail or SaaS businesses, benefit from monthly updates, while those with longer cycles find quarterly reviews sufficient, ultimately enabling better forecasting accuracy and strategic decision-making.
Common mistakes include using inconsistent time periods, overcrowding with excessive data points, choosing inappropriate chart types, neglecting to include context or benchmarks, and failing to clearly label axes and metrics. These errors can mislead stakeholders by obscuring actual performance trends, making it difficult for sales teams and executives to identify growth patterns, strategic opportunities, and areas requiring improvement, ultimately hindering data-driven decision making.
Sales growth charts can be tailored by emphasizing different metrics and timeframes, with investor-focused versions highlighting revenue milestones, market expansion, and quarterly performance trends, while internal team charts emphasize pipeline velocity, conversion rates, and territory-specific metrics. Through strategic data selection, organizations streamline stakeholder communication by delivering relevant insights, enhanced decision-making capabilities, and targeted performance tracking, ultimately enabling more effective resource allocation and strategic alignment across different organizational levels.
Seasonal trends in sales growth charts can be represented through year-over-year comparisons, quarterly breakdowns, monthly trend lines, seasonal indices, and overlapping period displays. These visualization methods enable businesses to identify cyclical patterns, anticipate demand fluctuations, and optimize inventory planning, with many retail and hospitality organizations finding that seasonal analysis ultimately delivers better forecasting accuracy and strategic resource allocation.
Sales growth charts enable businesses to forecast future performance by analyzing historical trends, identifying seasonal patterns, and calculating growth rates across different periods and product lines. Through predictive modeling and trend analysis, companies can anticipate market demands, allocate resources strategically, and set realistic sales targets, with many organizations finding that data-driven forecasting improves accuracy and enhances competitive positioning.
Line charts, bar charts, area charts, combination charts, and waterfall charts are most effective for displaying sales growth over time. These visualization methods enhance performance tracking by highlighting trends, comparing periods, and identifying growth patterns, with many sales teams finding that line charts for continuous trends and waterfall charts for incremental changes ultimately deliver clearer insights and faster decision-making.
A sales growth chart tracks percentage increases or decreases in sales over time, focusing on growth rates and trends, while a sales performance chart measures actual sales figures against targets, quotas, or benchmarks. Growth charts enable businesses to identify momentum patterns and forecast future revenue trajectories, whereas performance charts help sales teams assess quota achievement and operational effectiveness, ultimately delivering different strategic insights for revenue optimization.
Data visualization transforms sales presentations by converting complex metrics into compelling visual narratives that stakeholders can quickly understand and act upon. Through interactive charts, trend analyses, and performance dashboards, sales teams streamline client communications, accelerate decision-making processes, and demonstrate clear value propositions, with many organizations finding that visual storytelling ultimately delivers higher engagement rates and faster deal closures.
Sales growth charts help identify emerging market opportunities by revealing upward trends in specific segments, seasonal patterns, geographic variations, and customer demographic shifts. Through trend analysis and comparative data visualization, organizations can spot early indicators of market expansion, anticipate demand fluctuations, and strategically position resources, ultimately enabling proactive market entry and competitive advantage.
Qualitative insights that complement sales growth charts include customer feedback analysis, market sentiment evaluation, competitive positioning assessments, team performance observations, and seasonal behavior patterns. These insights help organizations understand the "why" behind numerical trends, with many sales teams finding that combining quantitative data with qualitative context delivers more strategic decision-making and sustainable growth outcomes.
Color coding is crucial for sales growth charts as it enables instant visual differentiation between product lines, time periods, performance metrics, and regional data, significantly enhancing comprehension speed. Strategic color choices streamline data interpretation, minimize cognitive load, and maximize presentation impact, with many sales teams finding that well-designed color schemes improve stakeholder engagement and accelerate decision-making processes.
Companies leverage historical sales growth charts to improve future strategies by identifying seasonal patterns, recognizing successful product cycles, analyzing market trends, and pinpointing growth accelerators or obstacles. Through comprehensive data analysis, organizations can optimize resource allocation, refine marketing timing, and adjust inventory management, while developing more accurate forecasting models, ultimately delivering enhanced competitive positioning and strategic decision-making capabilities.
-
Great designs, Easily Editable.
-
The content is very helpful from business point of view.