

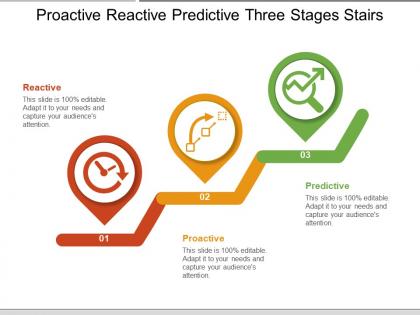
Proactive reactive predictive three stages stairs




Try Before you Buy Download Free Sample Product
 Impress Your
Audience
 100%
Editable
 Save Hours
of Time


Encourage enterprising ideas with our Proactive Reactive Predictive Three Stages Stairs. Hand out hints on how to improve.
People who downloaded this PowerPoint presentation also viewed the following :
Proactive reactive predictive three stages stairs with all 5 slides:
Folks are bound to heed your advice due to our Proactive Reactive Predictive Three Stages Stairs. You will influence the debate.


FAQs for Proactive reactive predictive
Okay so first thing - figure out exactly what you're trying to answer. Vague questions = total nightmare later. Then collect your data and clean it (which honestly takes forever, like 80% of your time). Make tons of visualizations during exploration - you'll catch weird stuff in your data that way. Pick analysis methods that actually fit what you're working with. Oh and document everything! I learned this the hard way when I forgot why I made certain decisions. Finally, present it so people can actually understand what you found. The cleaning part really is brutal though.
Look, statistical methods stop you from fooling yourself with random patterns. Proper sampling and significance tests? They're your safety net against drawing conclusions from pure coincidence. Honestly, I've seen too many people get excited about trends that were just noise. Cross-validation helps separate real insights from flukes, and controlling variables means you're actually measuring what matters. Two things will save you from most beginner errors: understanding your sample size and knowing your data distribution. Confidence intervals and hypothesis testing do the heavy lifting after that.
Honestly, just start with Excel or Google Sheets for the basics. Python with pandas is where it's at though - way better for bigger datasets and cleaning messy data. R's solid if you're into heavy stats work. For charts and dashboards, Tableau and Power BI are what most companies use (though Python's matplotlib works fine too, just uglier lol). Oh, and learn SQL - you can't do anything with databases without it. My take? Master Python first since it does everything, then worry about the fancy visualization tools later. Don't try learning five things at once or you'll just confuse yourself.
First figure out what you're actually trying to learn from your data - are you looking for patterns, testing relationships, or predicting something? Your variables matter too. Categorical vs numerical, sample size, whether things look normally distributed (though honestly most real data isn't perfectly normal anyway). I always start by just plotting stuff and looking at basic summary stats first. Sounds boring but it usually shows me which direction to go. Got relationships to explore? Try correlation or regression. Comparing groups? T-tests or ANOVA work well. Don't overthink it initially - simple approaches often work best.
Look, data cleaning is honestly where you'll live for like 60-80% of your project time - I know, it sucks. But skipping it is career suicide because garbage data = garbage insights that'll make you look terrible in meetings. You've gotta fix missing values, clean up inconsistencies, kill duplicates, standardize everything. It's tedious as hell but don't rush it. I learned this the hard way after presenting wonky results to my boss once. Clean data upfront saves you from so much pain later when you're building models or making charts.
Honestly, visuals are a game changer because people just absorb them faster than endless spreadsheet rows. You'll catch patterns and weird outliers right away - like that random Q3 spike that would've stayed hidden otherwise. Different chart types show different things too. Bar charts are great for comparing stuff, while scatter plots reveal correlations. I always start simple then add more complexity if people need it. The best part? You can actually walk stakeholders through your thinking instead of just dumping data on them.
Dude, the biggest mistake is diving straight into analysis without checking if your data is actually clean first. Missing values and weird outliers will mess you up every time. People also love cherry-picking results that match what they wanted to find anyway - I've totally done this myself. Write down your hypothesis before you start so you don't just chase whatever shiny pattern pops up. Don't overfit your models either. And honestly? That whole correlation vs causation thing still catches me off guard sometimes, even after years of doing this stuff.
Honestly, just start small and work ML into what you're already doing. I'd throw in some clustering or regression first - they're great at catching patterns you'd totally miss otherwise. Then back it up with your normal statistical tests. Works pretty well in my experience. Let the ML do the grunt work finding stuff, but keep your traditional methods for actually understanding what it means. Maybe try automated anomaly detection first? That's usually a safe bet. Once you get the hang of it, you can get fancier. Think of ML as your pattern-finding sidekick, not something that replaces everything else you do.
Ok so first things first - get proper permission and mask/aggregate the data to protect people's privacy. But here's the thing that freaks me out: even "anonymous" data can be traced back to individuals when you combine it with other datasets. It's honestly wild how easy re-identification can be. Think about who'll see your analysis too and how it might affect the actual people in your data. My take? Set up solid data rules from day one and check your practices regularly. Don't wait until something goes sideways.
Okay so basically your data type totally dictates what stats you can run. Quantitative stuff? You can do means, regressions, histograms, scatter plots - all that good numerical analysis. Qualitative data is different though. You're stuck with frequency counts, chi-square tests, bar charts. Honestly I make this mistake ALL the time when I'm exhausted - like trying to average out categories of ice cream flavors or whatever. Makes no sense! Quick thing - always figure out your data type before you start analyzing. Quantitative shows relationships and trends with actual numbers. Qualitative reveals patterns across different categories.
Lead with your biggest findings right away - don't bury them. Simple bar charts work way better than those fancy graphs that look impressive but confuse everyone. Ditch the jargon completely. If you absolutely need a technical term, explain it like you're telling your neighbor over coffee. Trust me on this - I've bombed presentations before by overcomplicating things. White space is your friend on slides. And here's the thing: executives care about one thing - how this affects the business. So connect every finding back to dollars or decisions. Always end with what they should actually do next, not some vague "we'll circle back" nonsense.
Document everything, seriously. Git for your code changes, detailed comments for your logic - trust me, you'll thank yourself later when you're staring at old code like "wtf was I doing here?? Version your software, save random seeds, keep raw data separate from the processed stuff. README files are clutch for explaining your workflow. Oh and actually test that someone else can run your analysis from scratch and get the same results. That's the real test of whether you've done it right.
Look at three things: did it actually help the business, was your work solid, and are people happy with it? The business part is key - check if you moved revenue or whatever metric you were going after. Technical stuff matters too (accurate models, clean data, can someone else reproduce your results). But honestly? Sometimes a decent analysis that everyone gets and uses is way better than some perfect thing that just collects dust. Oh, and definitely hash out what "success" looks like with your team before you start. Trust me on that one.
Dude, context is literally everything when you're digging into data. Same exact numbers can tell totally different stories depending on how they were collected. Like, December sales might look incredible until you realize - oh wait, Christmas happened. The backstory behind your data determines which patterns actually matter and which ones are just random noise. What was going on when this data got collected? That's honestly the first question I ask myself every time. Without understanding the circumstances, your analysis is pretty much useless. The numbers don't lie, but they definitely don't tell the whole truth either.
Think of hypothesis testing like being a skeptical detective with your data. You start with a null hypothesis - basically "nothing interesting is happening here" - then see if your results are strong enough to prove otherwise. Without this framework, you're just winging it when that conversion rate jumps 5%. Could be real, could be total fluke. The whole point is getting actual statistical confidence instead of relying on hunches. Honestly, it saves you from making embarrassing conclusions based on random noise. Way better than the "trust me bro" approach to data analysis.
-
Unique and attractive product design.
-
Great quality slides in rapid time.