

Diapositivas de presentación de Powerpoint del cuadro de mando de calidad del centro de llamadas




Try Before you Buy Download Free Sample Product
 Impress Your
Audience
 100%
Editable
 Save Hours
of Time


Los cuadros de mando son un sistema de gestión y planificación estratégica que se utiliza para alinear las tareas de la organización con su declaración de visión. Aquí hay un cuadro de mando de control de calidad del centro de llamadas diseñado profesionalmente que es una herramienta útil para realizar un seguimiento del servicio al cliente y el desempeño del agente. Además, le permite examinar objetivamente las fortalezas y debilidades de los agentes para ver qué áreas requieren un mayor desarrollo. La plantilla ofrece hojas de trabajo para medir las desviaciones abiertas, los niveles de servicio diarios, etc., que pueden usar varias organizaciones. Además, el PPT viene con un tablero para evaluar la satisfacción del cliente y el tiempo promedio de resolución de problemas. Nuestra presentación de PowerPoint incluye diapositivas que los centros de llamadas pueden usar para rastrear información vital, llamadas entrantes, riesgo de cumplimiento, calidad del representante de soporte, etc. Por último, esta plantilla ayuda a los centros de soporte de servicio a monitorear los objetivos del equipo de ventas, el volumen de llamadas, la resolución de la primera llamada FCR y el promedio Velocidad de Respuesta ASR. Reserve una demostración gratuita con nuestro equipo de investigación y diseño y personalice esta plantilla de cuadro de mando 100 % editable en función de sus necesidades comerciales específicas. Obtenga acceso ahora.
People who downloaded this PowerPoint presentation also viewed the following :
Contenido de esta presentación de Powerpoint
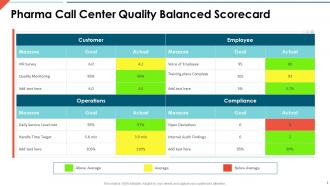
Diapositiva 1 : Esta diapositiva presenta el cuadro de mando integral de calidad del centro de llamadas de Pharma. Indique el nombre de su empresa y comience.
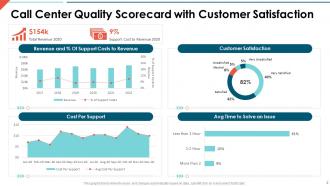
Diapositiva 2 : esta diapositiva muestra el cuadro de mando de calidad del centro de llamadas con satisfacción del cliente.
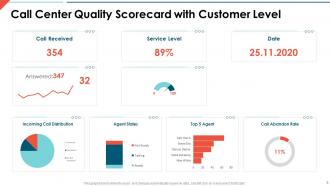
Diapositiva 3 : esta diapositiva presenta el cuadro de mando de calidad del centro de llamadas con nivel de cliente.
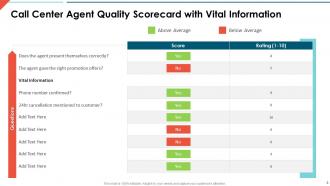
Diapositiva 4 : esta diapositiva muestra el cuadro de mando de calidad del agente del centro de llamadas con información vital.
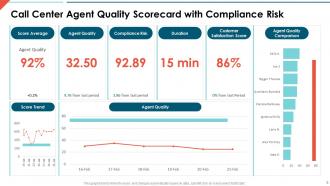
Diapositiva 5 : esta diapositiva muestra el cuadro de mando de calidad del agente del centro de llamadas con riesgo de cumplimiento.
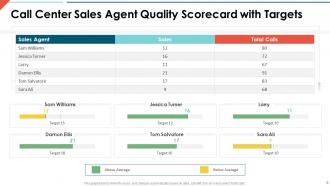
Diapositiva 6 : esta diapositiva representa el cuadro de mando de calidad del agente de ventas del centro de llamadas con objetivos.
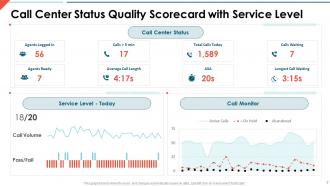
Diapositiva 7 : esta diapositiva muestra el cuadro de mando de calidad del estado del centro de llamadas con el nivel de servicio.
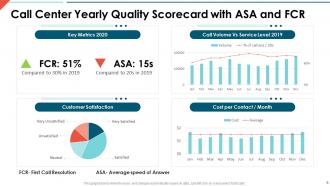
Diapositiva 8 : Esta diapositiva presenta el Cuadro de Mando de Calidad Anual del Call Center con ASA y FCR.
Diapositiva 9 : esta diapositiva se titula Diapositivas adicionales para avanzar.
Diapositiva 10 : esta diapositiva muestra iconos para el cuadro de mando de calidad del centro de llamadas.
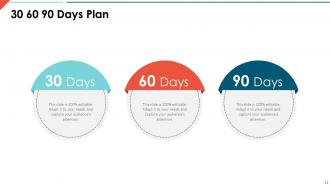
Diapositiva 11 : Esta diapositiva representa el Plan de 30 60 90 días con cuadros de texto.
Diapositiva 12 : esta diapositiva muestra la hoja de ruta con cuadros de texto adicionales.
Diapositiva 13 : Esta es una diapositiva financiera. Muestre sus cosas relacionadas con las finanzas aquí.
Diapositiva 14 : esta es una diapositiva de la línea de tiempo. Mostrar datos relacionados con los intervalos de tiempo aquí.
Diapositiva 15 : Esta diapositiva muestra el diagrama de Venn con cuadros de texto.
Diapositiva 16 : Esta diapositiva representa Post-It Notes. Publique sus notas importantes aquí.
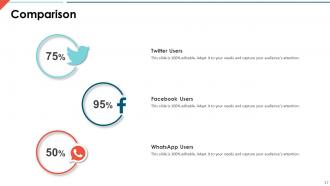
Diapositiva 17 : Esta es una diapositiva de comparación para establecer la comparación entre productos básicos, entidades, etc.
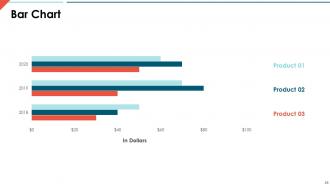
Diapositiva 18 : Esta diapositiva muestra un gráfico de barras con una comparación de tres productos.
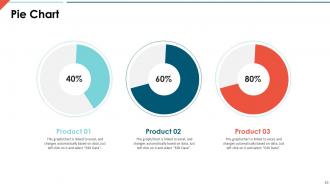
Diapositiva 19 : esta diapositiva muestra un gráfico circular con datos en porcentaje.
Diapositiva 20 : Esta es una diapositiva de agradecimiento con dirección, números de contacto y dirección de correo electrónico.
Diapositivas de presentación de Powerpoint del cuadro de mando de calidad del centro de atención telefónica con las 20 diapositivas:
Utilice nuestras diapositivas de presentación de Powerpoint del cuadro de mando de calidad del centro de atención telefónica para ayudarlo de manera efectiva a ahorrar su valioso tiempo. Están listos para encajar en cualquier estructura de presentación.

FAQs for Call center quality scorecard
So for tracking call center stuff, I'd focus on the basics first - customer satisfaction scores, first call resolution, and average handle time. Those three tell you most of what you need to know honestly. Then add in call abandonment rate, schedule adherence, and quality scores from when you monitor calls. Hold time and transfer rates matter too but don't go crazy with like 15 different metrics or you'll drown in data. Stick to maybe 6-8 that actually matter for your goals and review them weekly. That's what's worked for us anyway.
Honestly, scorecards are a game-changer for figuring out what's actually broken in your customer service. Track stuff like how long people wait on hold, whether issues get solved on the first call, if your agents are following the script (though some flexibility is good too). Here's the thing - the data shows you patterns you'd never notice otherwise. Like maybe everyone bombs the same type of call? Time for training. Pick 3-4 metrics your customers actually care about, then use what you learn to fix the real problems instead of guessing.
Honestly, training is everything when it comes to scorecard performance. Your agents can't hit targets they don't even understand, right? Good training programs directly boost communication skills, product knowledge, call resolution - all that stuff. I've literally watched teams jump 15-20 points just from better onboarding (which blew my mind the first time I saw it). But here's the thing - it can't be a one-and-done deal. You need ongoing coaching sessions and refreshers to keep everyone sharp. Start by figuring out where you're scoring lowest, then build specific training around those weak spots.
Honestly, I'd do monthly check-ins at bare minimum - quarterly is probably better though. Monthly catches problems early so you can make quick fixes. But quarterly gives you actual data to work with, not just random noise. Teams that wait longer are basically guessing at everything (and customer stuff changes way too fast for that). The trick is staying consistent instead of only looking when things blow up. Oh, and definitely get your actual agents involved - they know what's really happening out there. Set up those calendar reminders now or you'll totally forget.
First thing - get your agents involved when you're building the scorecard criteria. They'll actually use it if they helped create it, you know? Pick concrete stuff to measure: how they greet customers, problem-solving skills, call timing. Use the same 1-5 scale for everyone so you don't get that annoying situation where different managers have totally different standards. Score enough calls per person to get a real picture. Don't just grab random ones. And honestly? Be upfront about what you're tracking and why. The whole thing works way better when people see it as helpful feedback instead of some gotcha thing waiting to happen.
Honestly, the biggest win is that AI can process 100% of your calls instead of the usual 2-3% you'd manually score. It catches patterns in customer sentiment and agent performance that you'd totally miss otherwise. Tone, keywords, compliance stuff - it picks up on everything without having those off days we all have (no more inconsistent scoring because someone's cranky). The predictive part is pretty wild too - it can actually flag calls that'll probably turn into escalations or tank your CSAT scores before they blow up. I'd say start small though, maybe test it on compliance first. Once you see how much more accurate it is, you can roll it out wider.
Anonymous surveys are your best bet - people actually speak up when they're not worried about getting in trouble. I'd also try focus groups and one-on-ones with supervisors. Those pulse surveys work really well too. Oh, and maybe set up feedback boxes or some kind of digital suggestion thing? Some places do "scorecard committees" where agents rotate in to help review the criteria, which is pretty smart. The main thing is giving people different ways to share feedback since everyone's comfortable with different approaches. Then you've gotta actually do something with what they tell you - otherwise it's pointless.
So basically, inbound scorecards care about fixing problems - stuff like first call resolution and customer happiness. Outbound is totally different though. You're chasing conversion rates and sales numbers since you're calling people who didn't even want to talk to you (which sucks honestly). Inbound agents get scored higher on empathy and being nice. Outbound? It's all about handling objections and being persuasive. Figure out if your team's mainly solving issues or trying to make sales happen - that'll tell you which direction to go with your scorecard setup.
Honestly, scorecards work pretty well for keeping people around - like 20-30% better retention in most places I've seen. People just want to know where they stand, you know? When your team can actually see their numbers and understand what behaviors matter, they don't feel like they're being judged on random stuff. Focus on things they can actually fix though, not just end results. Oh, and don't turn it into some gotcha system where you're constantly catching people doing wrong things. Use it to help them get better instead. Agents who get regular feedback and clear expectations? They'll stick around way longer and actually improve their performance too.
Honestly, it really depends on your industry's specific rules and what your customers actually care about. Healthcare? You're gonna be all over HIPAA compliance and making sure agents sound empathetic - that stuff's huge. Finance is totally different though - security and fraud detection become way more critical. The basic communication skills are pretty much the same everywhere (thank god), but how much you weight each one changes big time. Like healthcare might make compassion 25% of the score, while finance puts accuracy and compliance at 30%. I'd start by writing down all your industry's non-negotiable requirements first, then build everything else around those.
Honestly, don't overcomplicate it. Too many metrics will just confuse your agents - stick to maybe 5-7 things they can actually work on. I've seen scorecards with like 20 categories and nobody knows what to focus on anymore. Skip measuring random stuff just because it's trackable. Soft skills matter way more than people think - customers would rather deal with someone nice than someone who follows every script perfectly. Oh and get your evaluators on the same page first. Nothing's worse than Agent A getting an 8 while Agent B gets a 5 for basically identical calls. Keep it simple and fair.
Honestly, the magic happens when you spot patterns in those scorecards. Find your top performers and figure out what they're doing right - boom, instant peer coaches. For people struggling? The data literally tells you where to focus instead of throwing random training at them. I swear, so many managers just guess what's broken and waste everyone's time. Set up some friendly competition with leaderboards, track improvements, make it fun rather than scary. Oh, and don't try to fix everything at once - pick your worst 3 problem spots and build action plans around those specific numbers. Way more effective.
Honestly, quality scorecards are a lifesaver for compliance stuff. In regulated industries like finance or healthcare, they help you track if agents actually followed required scripts and procedures. You don't want to get slammed with fines because someone forgot to read the privacy notice, right? Map your scorecard metrics directly to whatever regulations you're dealing with - stuff like "Did they get proper consent?" or "Was the disclosure read correctly?" It's not just about measuring quality for fun. You're literally protecting your business from audits and regulatory headaches. Just make sure everything aligns with your specific requirements.
So basically you want to weave customer feedback into your call scoring - make it worth like 20-30% of the total score alongside your usual metrics. Pull in CSAT scores, surveys, any follow-up comments they send. Yeah, it'll slow things down a bit since you gotta wait for responses to trickle in before you can finalize scores, but honestly? It's the only way to know if that call actually worked for the customer. I'd set up some kind of automated system to grab survey responses and dump them straight into your dashboard - saves you from chasing down feedback manually, which gets old fast.
Heat maps are your best friend here - red/yellow/green just clicks with everyone. Gauge charts work perfectly for satisfaction scores, and bar charts make team comparisons super obvious. Traffic light systems honestly beat most fancy graphics (learned that the hard way). Trend lines are must-haves for showing progress over time. Don't forget those little data callouts to point out the important stuff. The key is picking visuals that actually tell a story instead of making people squint at numbers all day.
-
Visually stunning presentation, love the content.
-
Visually stunning presentation, love the content.
-
Editable templates with innovative design and color combination.
-
Very unique, user-friendly presentation interface.