

Diagrama circular con aplicaciones empresariales Diseño plano de PowerPoint





Try Before you Buy Download Free Sample Product
 Impress Your
Audience
 100%
Editable
 Save Hours
of Time


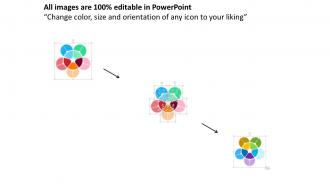
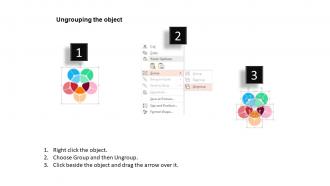
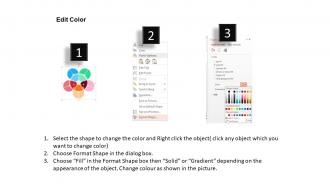
SlideTeam le presenta su Diagrama circular con aplicaciones empresariales Diseño plano de PowerPoint. Varios elementos, que son muy esenciales para el buen funcionamiento de una empresa, se pueden mostrar fácilmente con esta presentación de diapositivas PPT en forma de flor. Esta presentación de diapositivas de PowerPoint contiene el concepto de aplicaciones comerciales. Puede utilizar esta plantilla empresarial para mostrar diferentes funciones de diferentes grupos de una empresa. Esta plantilla de diagrama de ciclo circular se puede utilizar para presentar información relacionada con la fabricación, las ventas, los empleados, los objetivos, los productos y servicios ofrecidos por usted, etc. Con nuestra presentación de diapositivas de negocios de gráfico circular, puede mostrar el proceso de comunicación y la relación entre los diferentes departamentos que funcionan bajo una sola empresa. Utilice esta presentación de diapositivas PPT de diseño plano para llevar su negocio al siguiente nivel de éxito. Esta presentación de diapositivas PPT de símbolos florales se puede utilizar para hacer varios planes estratégicos que se requieren para el progreso y el crecimiento de una empresa. Si usa esta baraja de cuatro diapositivas hábilmente y bellamente diseñadas con presentación de diapositivas de flores redondas, definitivamente obtendrá buenos comentarios de todos los que se lo presenten. Nuestro gráfico circular con aplicaciones empresariales Flat Powerpoint Design son activos de empoderamiento. Utilícelos para modelar su carrera.
People who downloaded this PowerPoint presentation also viewed the following :
Gráfico circular con aplicaciones comerciales Diseño plano de Powerpoint con las 4 diapositivas:
Siéntase absolutamente alegre con nuestro gráfico circular con diseño de PowerPoint plano de aplicaciones comerciales. Tenga la seguridad de una excelente fortuna.

FAQs for Circular chart with business apps
So there's basically three main ones you'll run into. Pie charts are your go-to - everyone knows how to read them and they're perfect for showing percentages or budget stuff. Donut charts? Same thing but with a hole in the middle where you can stick a total or whatever. They look a bit more modern I guess. Then there's radial bar charts that wrap regular bars into a circle, but honestly they're kind of a pain to read. I'd just go with pie charts for most things since people don't have to think about it. Save donuts for when you really want that center number to pop.
Pie charts rock for showing parts of a whole - your brain just gets the proportions instantly. Way better than stacked bars for that stuff. They look clean on dashboards too, which is nice. Just don't go crazy with too many slices - maybe 5 or 6 max before it turns into a mess. Perfect for budget breakdowns or survey results where you want the big picture, not nitpicky comparisons. Honestly, data people love to hate on them but they're super effective when you use them right. Keep it simple and they'll do the job.
Honestly just stick with PowerPoint or Google Slides - their pie chart tools are pretty straightforward and you can make them look decent without much fuss. Excel's actually my go-to though, especially if you're working with messier data that needs cleaning up first. Oh and Canva's solid if you want something that looks more polished but aren't super technical. I mean, you could go crazy with Tableau or whatever, but that's probably overkill unless you're doing some fancy sunburst thing. Start with whatever you're already comfortable with - the built-in stuff usually does the job fine.
Use high contrast colors so people can actually tell your segments apart without squinting. Go light to dark or stick with your brand palette - honestly, random rainbow colors just look like a mess. Position all your labels the same way, either inside the slices or outside with those little lines. Oh and don't make a million tiny slivers that nobody can read. Group the small stuff into "Other" instead. Step back when you're done and see if you can spot the biggest chunks right away. That's basically your test.
Don't go crazy with slices - more than 5-7 gets messy fast. Always start your first slice at 12 o'clock, trust me on this one. Make sure your percentages actually add up to 100% (I've seen this mistake way too often). Skip the 3D effects - they look super dated and mess with your data. Similar-sized slices defeat the whole point since you're trying to show proportions. Oh, and if your labels get crowded, just use a legend instead of cramming text everywhere. Honestly, simple pie charts work way better than fancy ones.
Honestly, circular charts are perfect for breaking down complex stuff into chunks people actually understand. Pie charts work for basic proportions, but donut charts? Way better - you can stack multiple data sets or throw summary info right in the middle. Sunburst charts are where it's at though, especially for hierarchical data. They're basically pie charts but way cooler. Just don't go crazy with segments - stick to 5-7 max or you'll lose people. Oh, and start your biggest slice at 12 o'clock, then arrange by size. Makes everything way cleaner.
Honestly, the radius is just for looks - doesn't affect how you read the data. What matters are the angles. Each slice's angle shows you the proportion, so a 90-degree piece = 25% of your total. 180 degrees = half your data. This is why pie charts get messy when you have like 15 tiny slivers that all look the same size. Super annoying to read. Just double-check that the angles actually make sense for comparison purposes. Sometimes a regular bar chart is way clearer than trying to cram everything into a circle.
Okay so here's what works for me - start with your biggest slice because it grabs attention right away. Then walk through each piece like you're telling a story, not just rattling off percentages. Animation is honestly a game changer - reveal one slice at a time so people stay focused. Don't just show the numbers though, explain what they actually mean for your audience. Connect everything to real scenarios they care about. I know it sounds obvious but treat your chart like part of the bigger story you're telling. Always wrap up by telling them what they should do with this info.
Dude, you NEED legends and labels on circular charts or people will have no clue what they're looking at. Seriously, without them it's just pretty colors that mean nothing. Labels show the actual numbers or percentages, legends tell you what each slice represents. I learned this the hard way when my boss stared at my chart for like 30 seconds looking confused. Position them so they're readable but don't crowd everything. Here's my test - if someone can't figure out your chart in 5 seconds without you explaining it, you messed up.
Ugh, pie charts are such a pain when you've got tiny slices - anything under 5% just disappears. Our brains suck at reading angles anyway, so forget about getting precise comparisons. And don't even get me started on those awful 3D ones that make everything look warped. Time-based data? Negative numbers? Yeah, pie charts can't handle that stuff at all. Honestly, you'll have way better luck with bar charts if you're dealing with more than 5-6 categories or need people to actually understand the differences in your data.
For alt text, don't just say "pie chart" - describe what the data actually shows, like the percentages and main takeaways. Use high contrast colors and add patterns or textures so you're not only relying on color differences. A simple data table next to the chart works great too. Screen readers love tables, honestly. Make sure you're using proper ARIA labels if your tool supports them. Pie charts are kind of a pain even for people who can see them perfectly fine! The table backup is probably your best move for making sure nobody gets left out.
Honestly, less is more with these chart animations. I'd start with the whole thing appearing first, then maybe animate individual slices if you really need to emphasize something specific. That spinning pie chart thing? Total gimmick - just makes people nauseous lol. Gentle fade-ins work way better, or you could try subtle scaling effects. Time each element around 1-2 seconds tops, then give people a pause to actually process what they're seeing. The whole point is helping them understand your data, not showing off some fancy motion graphics skills.
Okay so circular charts are actually pretty flexible - just depends on what you're working with. Finance people love pie charts for showing portfolio splits, while marketing teams go crazy for donut charts in those colorful quarterly decks (seriously, they can't get enough). You'll see them used for audience segments, budget breakdowns, patient demographics - basically anything that's percentage-based. The trick is picking the right style. Simple proportions? Go with pie. Multiple data series work better as donuts. Need more precision? Try radial bar charts instead. Just figure out what story your percentages are telling first, then choose your format from there.
Yeah, don't use 3D pie charts if you want people to actually understand your data. The perspective makes slices in front look way bigger than they really are - it's this weird visual trick that throws everyone off. Your audience will totally misread what you're trying to show them. I mean, isn't the whole point to help people compare things accurately? Flat 2D charts are so much clearer. I guess maybe 3D could work if you're just going for looks over substance, but honestly that feels like a waste. Why make a chart that confuses people, you know?
Dude, audience feedback is seriously the best way to fix your circular charts. Watch for people squinting or asking "what's this section?" - dead giveaway your labels suck. Comments about not seeing differences between slices? Your colors are probably too similar. I've honestly learned way more from confused faces than design books ever taught me. Jot down what confuses people, then fix those exact things next time. Oh, and actually ask for feedback directly - don't just assume they'll volunteer it. Test your changes on the stuff that tripped people up most.
-
The content is very helpful from business point of view.
-
Professional and unique presentations.