


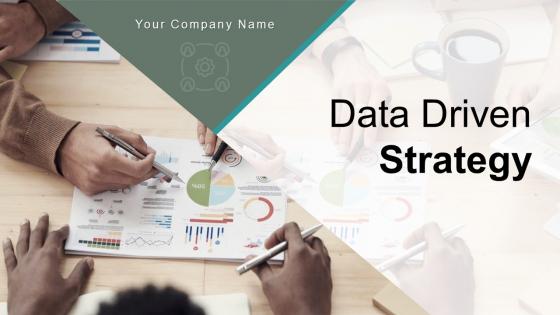
Data Driven Strategy Analytics Technology Approach Corporate





Try Before you Buy Download Free Sample Product
 Impress Your
 Audience
 100%
100% Editable
 Save Hours
 of Time


Big data and analytics have risen to the top of the business agenda. They promise to alter the way firms conduct business, offering the type of performance increases last seen in the 1990s, when organisations revamped their basic processes. And, as data-driven tactics gain traction, they will become an increasingly essential source of competitive distinction. SlideTeam’s data analytics PowerPoint templates can help you present your findings in an easy-to-digest format. We have a wide variety of templates to choose from, so you can find the perfect one for your needs. Plus, our team is always updating our library with the latest and greatest templates, so you can be sure you’re getting the most up-to-date information. Download our data analytics ppt now to get started on creating powerful presentations that will impress your audience and help you achieve your business goals.
People who downloaded this PowerPoint presentation also viewed the following :
Data Driven Strategy Analytics Technology Approach Corporate with all 13 slides:
Use our Data Driven Strategy Analytics Technology Approach Corporate to effectively help you save your valuable time. They are readymade to fit into any presentation structure.
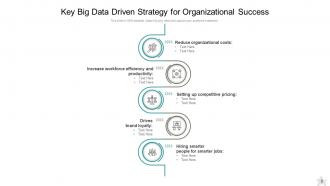

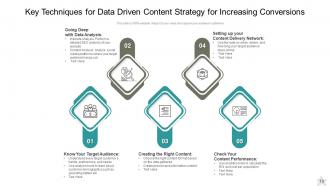
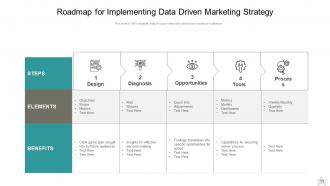
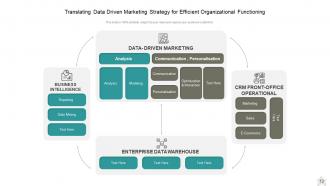

FAQs for Data Driven Strategy Analytics
So basically there are four types: **Descriptive** is just "what happened" - your basic reports and dashboards. **Diagnostic** digs into *why* things happened by spotting patterns. **Predictive** uses your old data to guess what's coming next (machine learning stuff usually). Then **prescriptive** actually tells you what to do about it. Most places start simple with descriptive and build up from there. Honestly, prescriptive is where things get really interesting but it's also the hardest to pull off. You should probably figure out what questions you're trying to answer first - that'll point you toward the right type.
Honestly, data analytics is a game-changer for this stuff. Look at purchase history, support tickets, website clicks - basically anything that shows what's annoying your customers. I read about some company that cut churn by 30% just by catching people who were about to bail based on how they browsed. Pretty smart if you ask me. You can get personal with it too - product recommendations, custom emails, all that. Oh, and don't try to boil the ocean right away. Pick something specific like your onboarding flow and really dig into those numbers first.
Dude, ML is a game changer for data stuff. Your computer basically finds patterns and makes predictions way faster than you ever could - we're talking minutes instead of hours of manually digging through spreadsheets. You can forecast sales, catch fraud, personalize customer stuff, whatever. The catch? Your data has to be clean first or you'll get garbage results. I'd honestly just grab a small dataset and mess around with some basic tools to start. Once you see it work, you'll get why everyone's obsessed with it. Pretty crazy how much time it saves.
Bar charts and line graphs are your go-to options - there's a reason they're everywhere. Pie charts work too, though honestly I'm not a huge fan unless you really need to show parts of a whole. Scatter plots are perfect when you want to show how two things relate to each other. Heat maps? Great for when you've got tons of data points. Dashboards mixing different chart types are pretty common now. But here's the thing - don't just use whatever Excel defaults to. Pick what actually tells your story best. Start with simple bars or lines, then only get fancy if it genuinely helps people understand better.
Oh man, data governance is huge - it's literally what everything else builds on. Without it, you'll waste most of your time just cleaning messy data instead of doing actual analysis (trust me on this one). When teams don't have the same definitions for metrics, everyone ends up with different numbers and nobody trusts anything anymore. Poor quality data? Forget about it. Start small though - pick your most important data sources first and get solid standards in place for those. The rest can wait honestly.
Privacy and consent are huge - make sure people actually agreed to have their data used. Bias is another big one; your algorithms might accidentally discriminate against certain groups without you realizing it. Data security matters too, obviously. Be upfront about your methods and what you can't do with the analysis. Honestly, the "would I want this done with my data" test works pretty well. Document everything from the start so you can show you thought through the ethical stuff. Legal issues can spiral quickly if you're not careful with permissions.
Honestly, just start with the free stuff - Google Analytics and Data Studio will handle like 90% of what you need. Your social platforms already have decent analytics built in too, so use those. Excel's actually way more powerful than people give it credit for, perfect for basic analysis. Here's the thing though - don't get caught up tracking everything. Pick 3-4 metrics that actually move the needle on revenue and focus on those. Oh, and definitely set up automated reports. Trust me, manually pulling data every week gets old fast. You've got better things to do with your time.
Honestly, it's all about what industry you're in. Finance and healthcare folks need the heavy-duty stuff - SAS, Tableau, Power BI - because compliance is a nightmare otherwise. Tech companies? They're obsessed with Python and R, especially pandas (which is actually pretty amazing once you get the hang of it). Marketing teams live in Google Analytics and Mixpanel for customer data. Manufacturing's weird though - they stick with Minitab for quality control stuff. Start with whatever your team already knows how to use, then upgrade when you hit walls or get more budget.
Pick your KPIs first - revenue bumps, time saved, faster decisions, whatever matters to you. Measure everything before you start so you've got a baseline. Here's the annoying part though: you'll need to figure out what actually came from your analytics versus all the other stuff happening at the same time (good luck with that). Track those same metrics after implementation and don't forget to include ALL your costs - tools, training, people's time, the works. Oh, and set up regular check-ins to see how it's going and tweak things if needed.
Biggest headaches you'll run into? Data velocity is brutal - streams come at you fast and maintaining quality gets messy when everything's flying by. Latency kills you too. Storage's another beast since you need systems handling constant writes. For solutions, grab stream processing tools like Kafka or Storm. Set up pipelines with validation built in, use in-memory databases for speed. Here's the thing though - don't go crazy trying to analyze everything instantly. Most stuff can wait until overnight batch processing, honestly. Just focus real-time efforts on what actually needs immediate attention. Oh, and start small with one use case first.
Dude, big data is wild - we're talking datasets so massive that your old Excel tricks are basically useless now. Volume, speed, variety... it's honestly pretty overwhelming at first. But here's where it gets cool: you can suddenly do predictive stuff and spot patterns across millions of data points in real time. Machine learning becomes actually feasible instead of just a buzzword. The tech requirements are intense though - cloud platforms, new processing tools, completely different skill sets. Oh, and don't try learning everything at once (I made that mistake). Pick one tool, get decent at it, then expand from there.
Real-time analytics is where it's at right now - nobody wants to wait until tomorrow for insights. AI predictive stuff is blowing up too, lets you see trends coming before they actually hit. Companies are also doing this thing where they give analytics tools directly to marketing teams and whoever, so they don't have to bug IT every time. Privacy regulations are making everyone paranoid (rightfully so) about how they handle data. Honestly I'd start by looking at what you've got now and figure out where you can add real-time features first.
Honestly, data storytelling is a game changer - it turns your boring spreadsheets into something people actually care about. You know how everyone's eyes glaze over during those painful dashboard meetings? Well, instead of just dumping charts on people, you're creating this whole narrative with a beginning, middle, and end. Start with your biggest insight first - the "holy crap, look at this" moment. Then use your data to back it up, not the other way around. I learned this the hard way after watching too many people scroll through their phones during my presentations. When you frame findings like a story with real conflict and stakes, people suddenly pay attention and remember what you said.
Okay so definitely learn SQL and Excel first - those will get you in the door anywhere. Python or R is basically expected now for the statistical stuff. Here's the thing though, being able to explain your findings to people who don't live in spreadsheets is honestly just as important as the technical side. Tableau or Power BI will be your best friend for making pretty charts that actually tell a story. Don't sleep on developing your business sense either - you'll spend half your time figuring out if the data even makes sense or if something's broken upstream. I'd start with SQL if you're missing that piece.
Healthcare and finance are killing it with analytics right now. AI diagnostics, fraud detection, algorithmic trading - it's all getting pretty wild. Amazon's recommendation stuff and that creepy dynamic pricing that changes every few minutes? That's retail analytics at work. Manufacturing companies are using predictive maintenance to avoid expensive equipment failures. Oh, and transportation is big too - route optimization, fuel efficiency, all that. Marketing's completely different now than like five years ago. Honestly though, if you're thinking about switching focus, I'd go healthcare analytics. That's where the interesting problems are, plus they actually have money to spend on solutions right now.
-
Editable templates with innovative design and color combination.
-
Colors used are bright and distinctive.
-
Topic best represented with attractive design.
-
Appreciate the research and its presentable format.
-
The content is very helpful from business point of view.
-
Perfect template with attractive color combination.
-
Much better than the original! Thanks for the quick turnaround.
-
Colors used are bright and distinctive.
-
Excellent Designs.