


Effective Time Planning PowerPoint Presentation Slides


Try Before you Buy Download Free Sample Product
 Impress Your
 Audience
Editable
of Time


Our Effective Time Planning PowerPoint Presentation Slides are topically designed to provide an attractive backdrop to any subject. Use them to look like a presentation pro.
People who downloaded this PowerPoint presentation also viewed the following :
Content of this Powerpoint Presentation
Slide 1: This slide introduces Effective Time Planning. State Your Company Name and begin.
Slide 2: This is an AGENDA slide. State your agendas here.
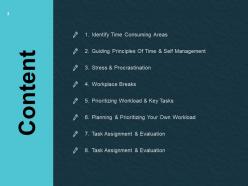
Slide 3: This slide shows Content for the presentation.
Slide 4: This slide displays Identify Time Consuming Areas with related imagery and text boxes to show information.
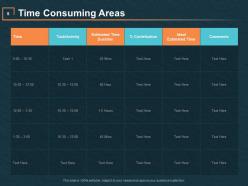
Slide 5: This slide presents Time Consuming Areas in a table form to show information.
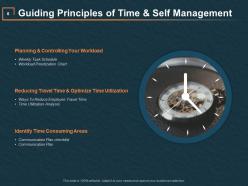
Slide 6: This slide represents Guiding Principles of Time & Self Management with- Planning & Controlling Your Workload, Reducing Travel Time & Optimize Time Utilization, Identify Time Consuming Areas.
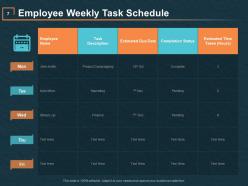
Slide 7: This slide showcases Employee Weekly Task Schedule with employee name, task description, estimated due date etc.
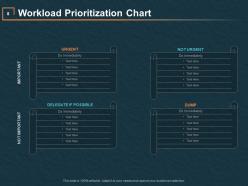
Slide 8: This slide shows Workload Prioritization Chart with categories as DELEGATE IF POSSIBLE, DUMP, URGENT, NOT URGENT.
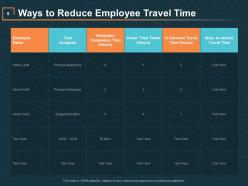
Slide 9: This slide suggests Ways to Reduce Employee Travel Time in a table form with categories as- employee name, task assigned, actual time taken etc.
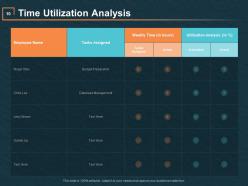
Slide 10: This slide presents Time Utilization Analysis in a table form with categories as- tasks assigned, utilisation analysis etc.
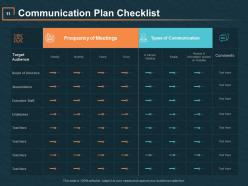
Slide 11: This slide displays Communication Plan Checklist describing- Target audience, board of directors, shareholders, employees etc.
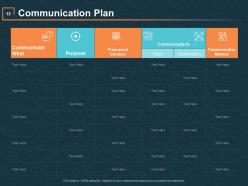
Slide 12: This slide represents Communication Plan describing- communicate what, purpose, frequency duration etc.
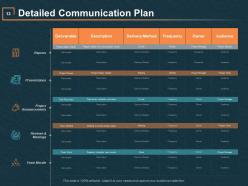
Slide 13: This slide showcases Detailed Communication Plan with- Reports, Team Morale, Project Announcements, Presentations, Reviews & Meetings.
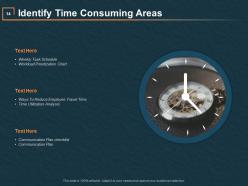
Slide 14: This slide shows Identify Time Consuming Areas with related imagery and text boxes to show information.
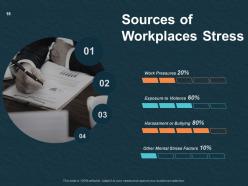
Slide 15: This slide presents Sources of Workplaces Stress describing- Work Pressures, Exposure to Violence, Harassment or Bullying, Other Mental Stress Factors.
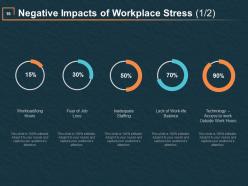
Slide 16: This slide showcases Negative Impacts of Workplace Stress describing- Workload/long Hours, Fear of Job Loss, Inadequate Staffing, Lack of Work-life Balance, Technology – Access to work Outside Work Hours.
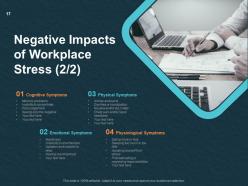
Slide 17: This is another slide on Negative Impacts of Workplace Stress describing- Cognitive Symptoms, Physical Symptoms, Emotional Symptoms, Physiological Symptoms.
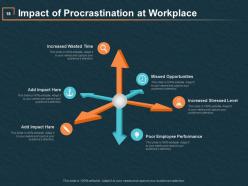
Slide 18: This slide shows Impact of Procrastination at Workplace which includes- Increased Wasted Time, Missed Opportunities, Increased Stressed Level, Poor Employee Performance etc.
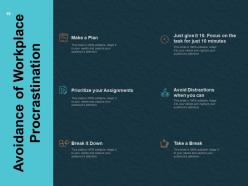
Slide 19: This slide presents Avoidance of Workplace Procrastination describing- Make a Plan, Break it Down, Prioritize your Assignments, Take a Break, Avoid Distractions when you can, Just give it 10. Focus on the task for just 10 minutes.
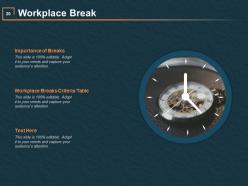
Slide 20: This slide displays Workplace Break with related imagery and text boxes to show information.
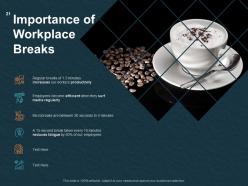
Slide 21: This slide represents Importance of Workplace Breaks with imagery and text boxes.
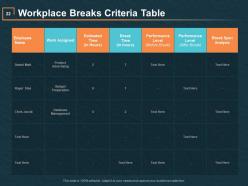
Slide 22: This slide showcases Workplace Breaks Criteria Table with categories as employee name, work assigned, estimated time, performance level etc.
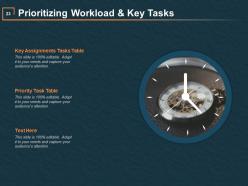
Slide 23: This slide shows Prioritizing Workload & Key Tasks describing- Key Assignments Tasks Table, Priority Task Table etc.
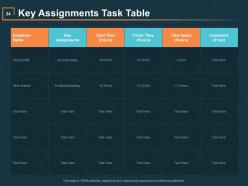
Slide 24: This slide presents Key Assignments Task Table with categories as employee name, key assignments, start time, finish time etc.
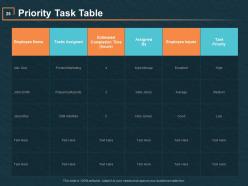
Slide 25: This slide displays Priority Task Table with categories as tasks assigned, estimated completion time, employee inputs etc.
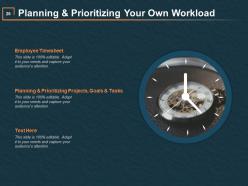
Slide 26: This slide represents Planning & Prioritizing Your Own Workload describing- Employee Timesheet, Planning & Prioritizing Projects, Goals & Tasks etc.
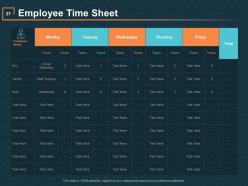
Slide 27: This slide showcases Employee Time Sheet in a table form with related text.
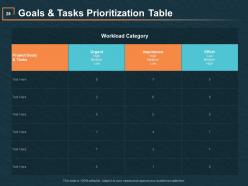
Slide 28: This slide shows Goals & Tasks Prioritization Table with categories as- Project goals, importance, effort etc.
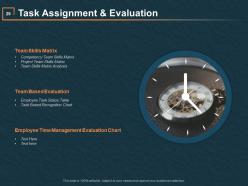
Slide 29: This slide presents Task Assignment & Evaluation describing- Team Skills Matrix, Team Based Evaluation, Employee Time Management Evaluation Chart.
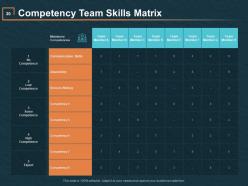
Slide 30: This slide displays Competency Team Skills Matrix with members, communication skills, adaptability, decision making etc.
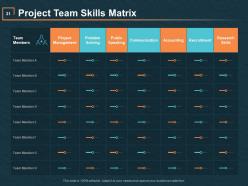
Slide 31: This slide represents Project Team Skills Matrix with team members, project management, problem solving, public speaking etc.
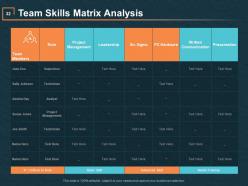
Slide 32: This slide showcases Team Skills Matrix Analysis with team members, role, leadership, presentation etc.
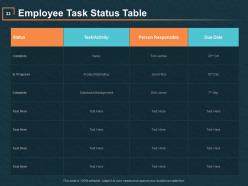
Slide 33: This slide shows Employee Task Status Table with status, activity, person responsible and due date.
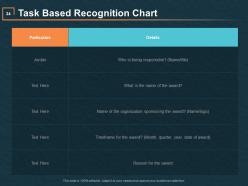
Slide 34: This slide presents Task Based Recognition Chart with related text boxes.
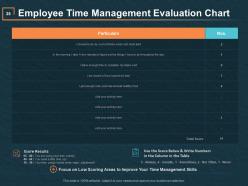
Slide 35: This slide displays Employee Time Management Evaluation Chart in a table form with text boxes to show information.
Slide 36: This slide represents Task Assignment & Evaluation describing- Team Skills Matrix, Team Based Evaluation, Employee Time Management Evaluation Chart.
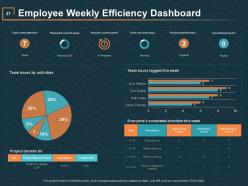
Slide 37: This slide showcases Employee Weekly Efficiency Dashboard with donut chart, pie chart, bar graph and table to show information.
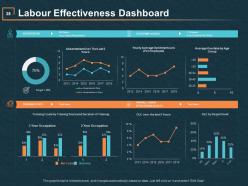
Slide 38: This slide shows Labour Effectiveness Dashboard with bar and line graphs to show information.
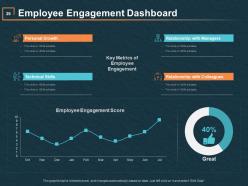
Slide 39: This slide presents Employee Engagement Dashboard describing- Technical Skills, Personal Growth, Relationship with Managers, Relationship with Colleagues.
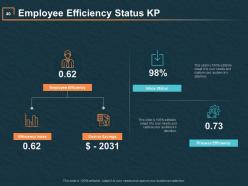
Slide 40: This slide displays Employee Efficiency Status KP describing- Efficiency Index, Cost or Savings, Employee Efficiency, Process Efficiency, Inbox Status.
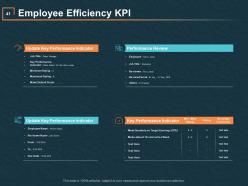
Slide 41: This slide represents Employee Efficiency KPI with- Key Performance Indicators and performance review.
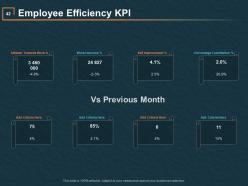
Slide 42: This slide showcases Employee Efficiency KPI describing- Percentage Contribution, Attitude Towards Work, Work Outcome, Self Improvement etc.
Slide 43: This slide shows Time Control Icons.
Slide 44: This slide is titled as Additional Slides for moving forward.
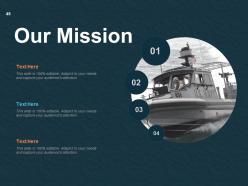
Slide 45: This is Our Mission slide with related imagery and text.
Slide 46: This is Our Team slide with names and designation.
Slide 47: This is About Us slide to show company specifications etc.
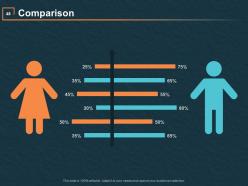
Slide 48: This is a Comparison slide to state comparison between commodities, entities etc.
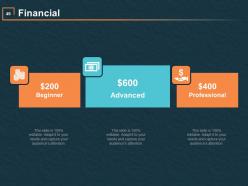
Slide 49: This is a Financial slide. Show finance related studd here.
Slide 50: This is Quotes slide to highlight or state anything specific.
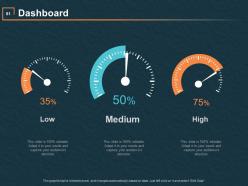
Slide 51: This slide shows Dashboard displaying low, medium and high. Show relevant data accordingly.
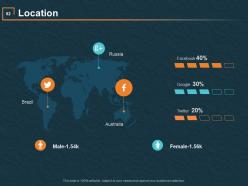
Slide 52: This is a Location slide with country maps to show data of different locations.
Slide 53: This slide displays Important Notes. Post your important notes here.
Slide 54: This is a Puzzle slide with text boxes to show information.
Slide 55: This is a Venn slide with text boxes.
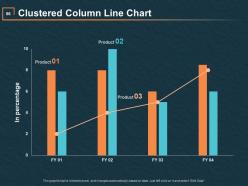
Slide 56: This slide shows Clustered Column Line Chart with three products comparison.
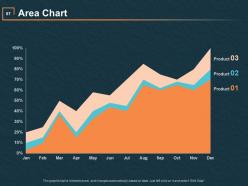
Slide 57: This slide presents Area Chart with three products comparison.
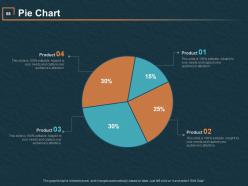
Slide 58: This slide displays Pie Chart to compare four different products.
Slide 59: This is a Thank You slide with address, contact numbers and email address.
Effective Time Planning PowerPoint Presentation Slides with all 59 slides:
Use our Effective Time Planning PowerPoint Presentation Slides to effectively help you save your valuable time. They are readymade to fit into any presentation structure.


FAQs for Effective Time Planning
Honestly, start by figuring out your top 3 things each day and do those when you're not running on fumes. Time blocking is a game changer - I literally put "focus work" on my calendar like it's a real meeting. Multitasking is such a lie, by the way. Don't fall for it. Instead, batch similar stuff together and actually say no to things that don't matter. Oh, and track your time for a few days first. You'll probably hate what you discover, but it's super eye-opening. The whole thing comes down to being intentional instead of just bouncing around reacting to everything.
Dude, templates are seriously a game changer. You'll skip all that staring-at-blank-slides nonsense and jump right into the actual planning stuff. I used to burn like 30 minutes just making things look decent before I could even think about timelines. With a template, you just fill in your milestones and deliverables. Everyone stays on the same page too since you're all looking at the same format. It's way easier to catch timeline gaps when everything's organized consistently. Oh and bookmark a few good ones now - trust me, you don't want to be scrambling for templates during your next kickoff.
Dude, seriously - ranking your tasks by what's actually urgent vs just busy work will change everything. I used to be that person answering emails in order like some kind of maniac, which is basically letting everyone else run your day. Not smart. Block out time for your top 3 must-dos first thing in the morning before everything goes sideways. Hit the high-impact stuff when you're still sharp instead of scrambling at 5pm wondering where the day went. Game changer, trust me.
Dude, templates are seriously a lifesaver for beating that blank page thing. You know when you just sit there staring at PowerPoint like an idiot? Yeah, that. Having a solid structure already laid out means you can jump straight into your actual content. Charts and icons help explain stuff way better than paragraphs of text too. I used to waste SO much time messing with fonts and spacing - honestly such a rabbit hole. Now I just grab pre-made elements and I'm done in half the time. Start collecting templates for different presentation types. Trust me on this one.
Dude, tech is like having a personal assistant for your schedule. Apps can track your time automatically, calendars block out focus periods, and scheduling tools cut out all that "when works for you?" nonsense. I'm weirdly into the ones that group similar tasks together - saves so much mental energy. Don't go crazy though. Pick maybe 2-3 tools and actually stick with them instead of downloading everything. Oh, and start with whatever wastes most of your time. For most people that's probably email or calendar stuff, but you know what kills your day.
Honestly, the biggest thing is matching tasks to people's actual strengths - don't dump everything on your best person while someone else just coasts. I made that mistake once and it was a disaster! Make deadlines crystal clear upfront, and use some kind of shared tracker so you're not constantly bugging people for updates. Trust me, nobody likes a micromanager hovering over their shoulder. Set up regular check-ins instead - maybe weekly or whatever works. Oh, and create an environment where people actually feel comfortable asking questions. Half the time projects fail because someone was too scared to speak up when they got stuck.
Ugh, endless meetings with no agenda are the worst - total productivity killer. Social media scrolling gets me every time too. Multitasking is basically a scam your brain falls for. You think you're being efficient but really you're just scattered. Perfectionism on stuff that doesn't even matter? Yeah, that'll destroy your whole day. Try batching similar tasks together instead of bouncing around. Set specific email times or you'll check it 500 times. Track your time for a week - you might be shocked where it actually goes. Oh, and learn to skip pointless meetings!
Honestly, these frameworks just force you to be realistic about time instead of lying to yourself. I mean, we've all been there with those ambitious to-do lists that never get done, right? Agile sprints, Kanban boards - whatever you pick will make you actually estimate how long stuff takes. Plus you'll spot those annoying bottlenecks before they completely derail you. The batching thing is huge too. You're not constantly switching between different types of work. Just start small though - maybe timebox your day and see what clicks. Way better than the chaos I used to live in.
Honestly, deadlines are a lifesaver with presentation templates. You'll stop obsessing over tiny font changes and actually focus on your content. Templates already handle the design work anyway, so you're not building everything from scratch. The time crunch makes you figure out what really matters vs what's just fluff - I learned this the hard way after spending 3 hours on slide transitions once. Super dumb. Try setting your deadline like 20% earlier than when it's actually due. Gives you breathing room for those inevitable last-minute tweaks without the panic.
Honestly, time-blocking is a game changer for presentations. You batch similar stuff together instead of jumping around randomly. So like, 9-11am is just research time, then maybe 2-4pm for slides only. Your brain doesn't have to keep switching modes, which is exhausting tbh. I usually do 90-minute blocks - any longer and I'm fried, shorter feels rushed. It stops that annoying thing where you sit there for hours but somehow accomplish nothing meaningful. Actually forces you to focus instead of pretending you're being productive while scrolling your phone every five minutes.
Okay so I started doing this 2-minute breathing thing every morning to figure out what I actually need to focus on. Game changer honestly. Before jumping into work, I pause and ask myself what's truly urgent vs what just *feels* urgent - there's a huge difference. Single-tasking is where it's at too, like actually paying attention to one thing instead of bouncing around everywhere. Oh and when I'm stressed? Quick body scan helps me reset. The trick is sneaking these tiny mindful moments into stuff you're already doing rather than creating more work for yourself.
Honestly, there's a bunch of ways to do this. Toggl and RescueTime are pretty cool - they'll spy on your computer usage which feels weird but gives you real data. Or just block out time in your calendar and stick to it. I've been using a regular notebook lately, nothing special, just writing down what I did and for how long. Pick whatever won't annoy you after three days because consistency matters way more than having the perfect system. Oh, and actually look at your patterns after a week - that's when it gets interesting.
Honestly, agendas are a game changer. Send one out the day before with time blocks for each topic - people actually show up prepared instead of winging it. No more of those painful tangents where someone goes on about their weekend plans for 10 minutes. You'll knock out the important stuff in order and actually end on time (which everyone secretly loves you for). I learned this the hard way after sitting through way too many rambling meetings. Just stick to your time limits and don't let people derail things. Your coworkers will thank you.
Oh dude, you should totally start timing yourself when making slides - it's wild how long stuff actually takes vs what you think. Templates help you batch similar work together, like knocking out all your research first, then layouts. Set mini-deadlines for each section or you'll end up obsessing over one slide for hours (guilty as charged lol). Honestly tracking this stuff makes budgeting time for future decks way more realistic. I used to be terrible at estimating presentation time until I started actually paying attention to where those hours disappear to.
Honestly, it starts with leadership walking the walk - no sending emails at midnight, actually sticking to meeting schedules. Your team needs real tools too: decent project management software, realistic deadlines, maybe some training on how to prioritize stuff. But here's what really gets me - you can't preach efficiency while drowning people in impossible workloads. That's just cruel. Build time management into performance reviews and celebrate the smart workers, not just the ones pulling all-nighters. Results matter way more than hours anyway.
-
Attractive
-
Attractive design and informative presentation.
-
Graphics are very appealing to eyes.
-
Great product with highly impressive and engaging designs.
-
Use of icon with content is very relateable, informative and appealing.
-
Professional and unique presentations.